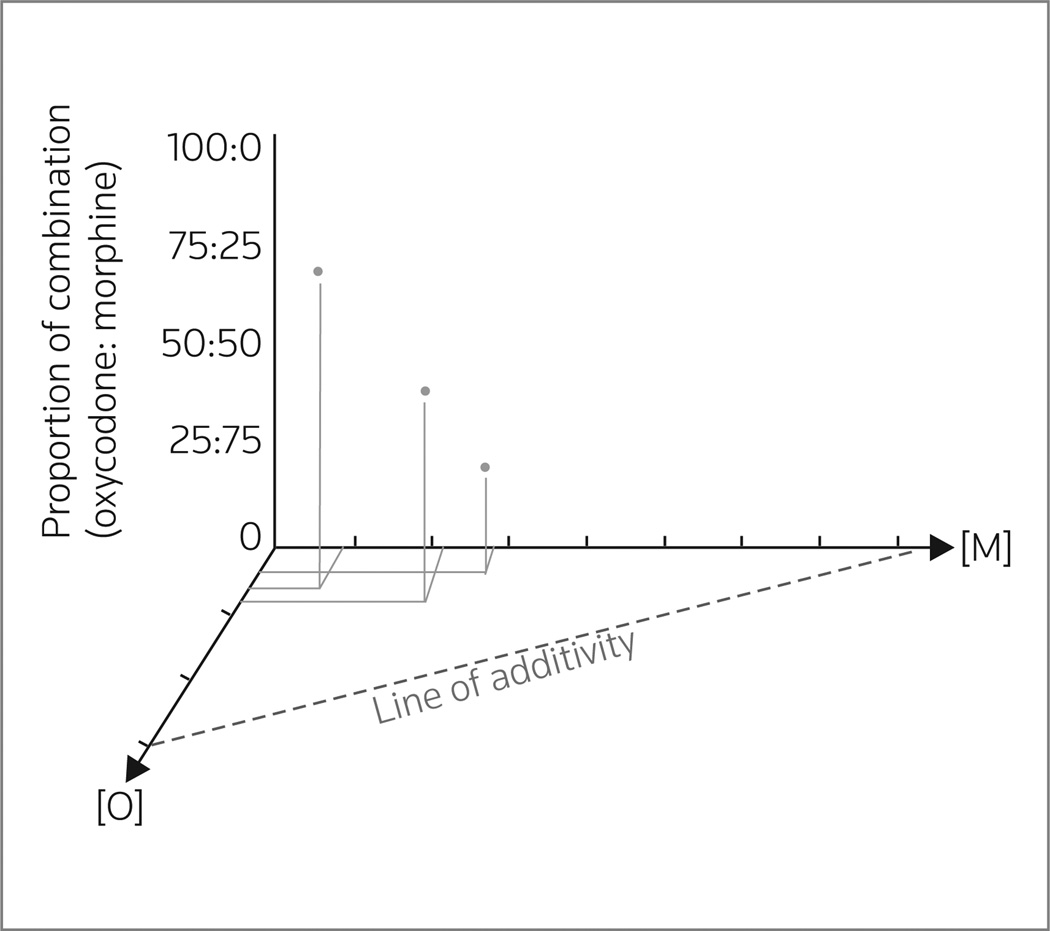
Figure 1.
Three-dimensional representation of the isobologram generated for the antinociceptive interaction between oxycodone [O] (mg/kg) and morphine [M] (mg/kg). Antinociception was assessed for each drug alone (ED50 doses = the [O] and [M] axis intercepts of the line of additivity) and for three fixed-ratio combinations of oxycodone + morphine (75%:25%, 50%:50% and 25%:75%). The combination ED50 doses (filled circles) were between the origin and the line of additivity (projected onto the horizontal plane in this representation), which is indicative of a synergistic interaction (data obtained from 46).

