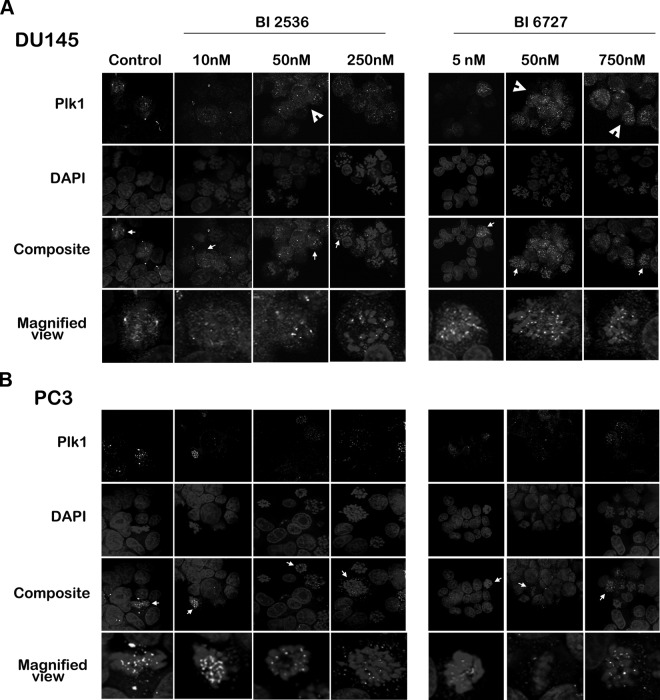
Figure 3.
Plk1 inhibition results in a differential response in the cellular distribution of Plk1 among PCa cell lines. DU145 (A) and PC3 (B) cells were treated for 24 h with BI 2536 (left) or BI 6727 (right), fixed, and stained with DAPI and Plk1 antibody. Cells were visualized under a confocal microscope. BI treatment led to an increase in cytoplasmic staining of Plk1 in DU145 cells (arrowheads), which seemed to be dose dependent. A representative cell in the composite image (arrow) is magnified below. Plk1 is visible on spindles, kinetochores, and poles of control cells. BI-treated cells retain kinetochore Plk1 staining while exhibiting increased cytoplasmic staining in DU-145 cells. PC3 cells exhibit a relative absence of cytoplasmic Plk1 staining. Image is a representative image of ≥3 independent experiments.

