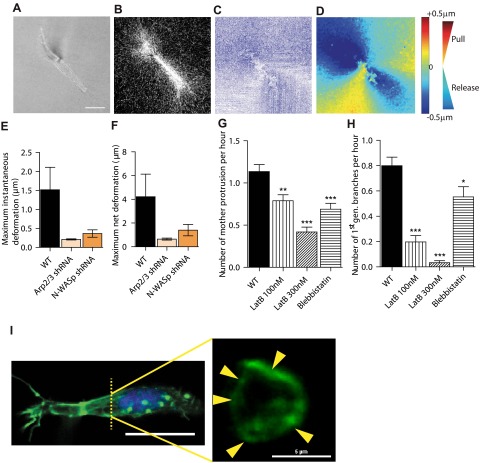
Figure 4.
Arp2/3 and N-WASP mediate local matrix traction during 3D cell migration and actin architecture of cells. A–D) Particle (PIV) method used to map the time-dependent deformation field of the matrix generated by individual cells in a 3D matrix. Phase contrast (A) and reflection confocal micrograph (B) are simultaneously recorded every 2 min for 2 h to generate instantaneous strain fields of the matrix (C) and determine regions of matrix traction (red; matrix movement toward the cell) and matrix release from the cell (blue; movement away from the cell) (D). E, F) Average instantaneous deformation (E) and maximum deformation (F) of the matrix of fiduciary points located at ∼10 μm distance from the cell. G, H) Rate of formation of mother protrusions (G) and daughter protrusions (H) for control cells and cells treated with actin depolymerizing drug latrunculin B and myosin II inhibitor blebbistatin. *P < 0.05, **P < 0.01, ***P < 0.001 vs. WT. I) Architecture of the actin filament network in matrix-embedded cells, evaluated by confocal microscopy. Maximum confocal projection (left panel) shows the elongated morphology and side protrusions in cells in matrix. Cross sections of the same cell (right panel) reveal that the actin network in protrusions is constituted of cortical bundles. Arrows indicate distinct longitudinal actin filament bundles positioned at the periphery of cell protrusions.

