
Figure 2.
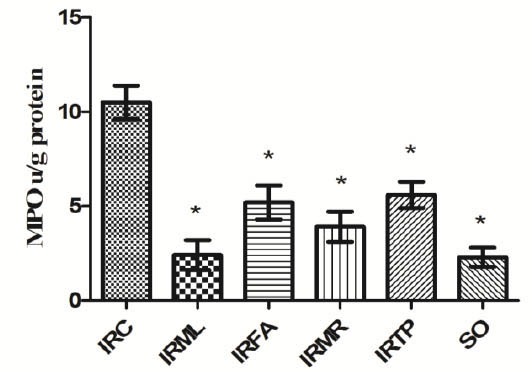
Comparison of the IRC, IRML, IRFA, IRMR, IRTP and SO groups in terms of MPO levels. Differences among groups were obtained using ANOVA post-hoc with the least significant difference option. Bars are means ± SD. MPO levels defined in u/g protein. IRC, control group; IRML, ovarian ischemia reperfusion + melatonin; IRFA, ovarian ischemia reperfusion + famotidine; IRMR, ovarian ischemia reperfusion + mirtazapine; IRTP, ovarian ischemia reperfusion + thiamin pyrophosphate groups and SO, healthy sham operation groups.
* P ≤ 0.01 was significant