
Figure 4.
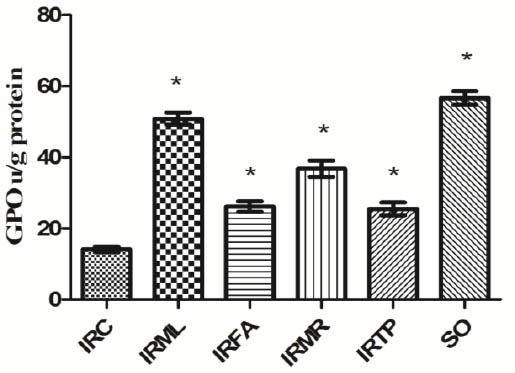
Comparison of the IRC, IRML, IRFA, IRMR, IRTP and SO groups in terms of GPO levels. Differences among groups were obtained using ANOVA post hoc with the least significant difference option. Bars are means ± SD. GPO levels defined in u/g protein. IRC, control group; IRML, ovarian ischemia reperfusion + melatonin; IRFA, ovarian ischemia reperfusion + famotidine; IRMR, ovarian ischemia reperfusion + mirtazapine; IRTP, ovarian ischemia reperfusion + thiamin pyrophosphate groups and SO, healthy sham operation groups
* P ≤ 0.01 was significant