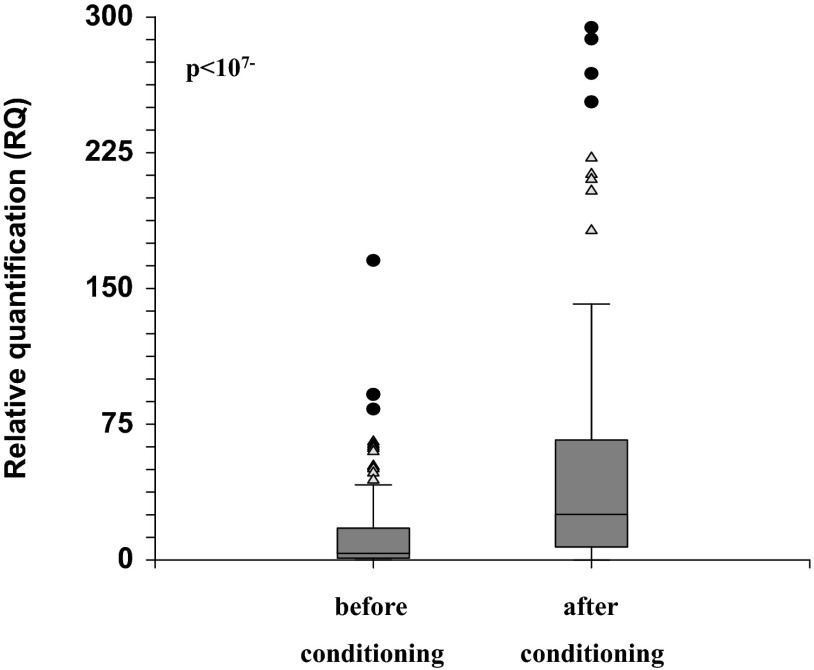
Figure 2. Expression levels of the HPSE gene in total PBLs before and after conditioning.
Expression level of HPSE mRNA was examined in total PBLs, pre- and postconditioning, in 124 transplanted patients. Blood samples were collected 1 day prior to conditioning and 24 h post last dose of chemotherapy, pretransplantation. Conditioning regimens led to a significant increase in heparanase expression levels. Triangles represent mild outliers, and circles represent severe outliers.

