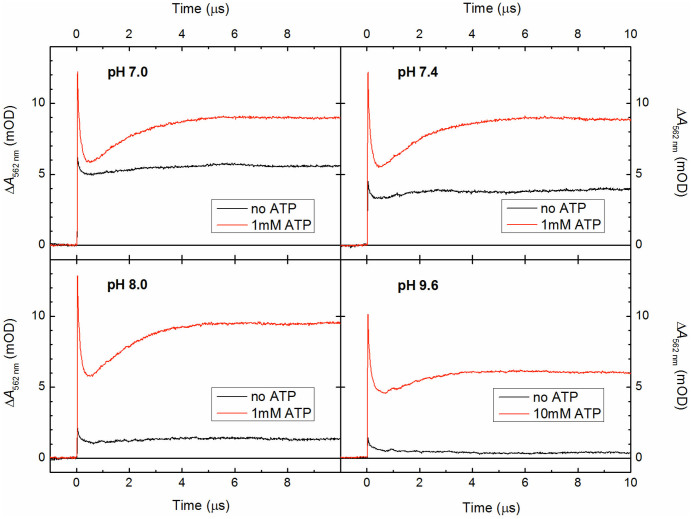
Figure 3. Nanosecond-microsecond kinetic traces for AtCRY1 PHR at different pH values.
Transient absorption changes were recorded at 562 nm upon excitation of FADox by a picosecond laser pulse (3.5 mJ at 355 nm, at time zero) in the absence (black traces) and in the presence of ATP (red traces). While 1 mM ATP was largely sufficient to saturate the ATP effect on the signal amplitude at pH ≤ 8, more ATP had to be added to the sample at pH 9.6 in order to reach full saturation (possibly due to the fact that ATP hydrolyses rapidly at high pH). The samples contained 45 μM protein, 0.05 M phosphate buffer of pH 7.0 to 8.0 or 0.05 M Tris buffer of pH 9.6 and 0.5 M NaCl and were kept at 1–2°C.

