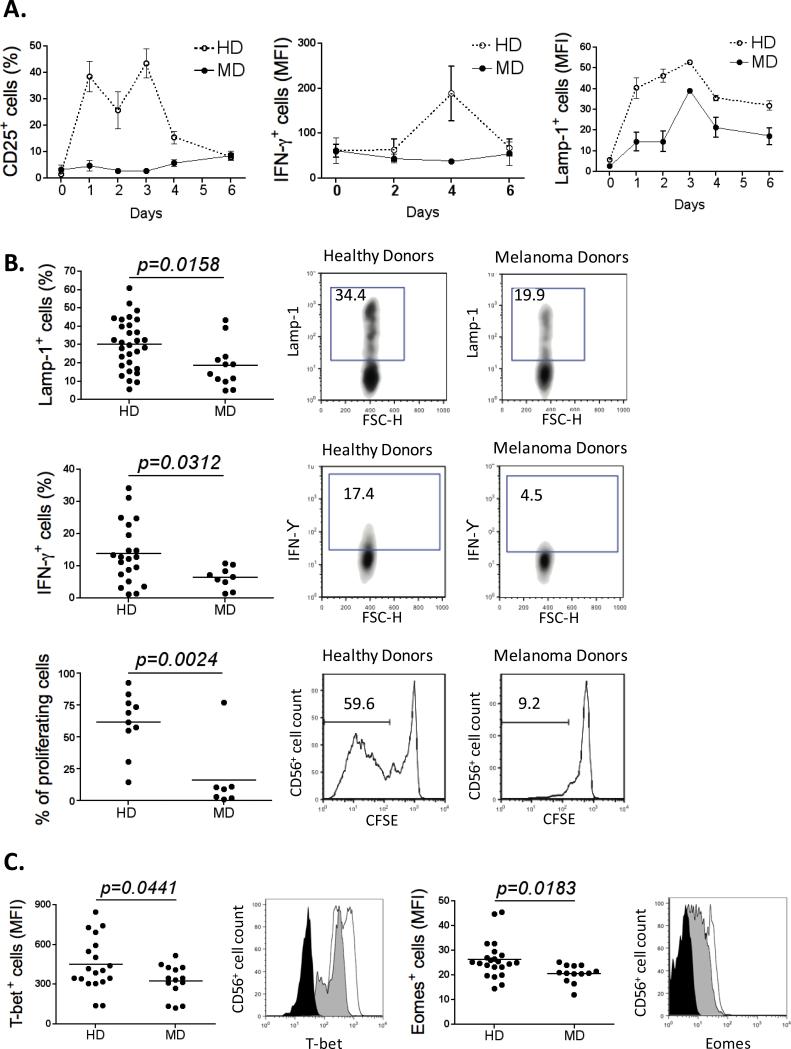
Figure 2. MD NK cells are functionally impaired/exhausted.
(A) Freshly purified NK cells (HD n=12; MD n=5) were stimulated with 200U/ml of IL-2. Expression of IL-2R (α chain), IFNγ production, and cytotoxicty were monitored every two days over 6 days (day 0, 2, 4 and 6) by flow cytometry. (B) The percentage of Lamp-1+ NK cells from healthy (n=30) and melanoma donors (n=12) after a cytotoxic assay is shown using K562 cells as target cells (upper left panel). The percentage of IFNγ+ NK cells from healthy (n=22) and melanoma donors (n=9) is shown after 4h stimulation with IL-12 (middle left panel). The percentage of proliferating NK cells from healthy (n=10) and melanoma donors (n=7) is shown after 6 days of culture in presence of 200U/ml of IL-2 (lower left panel). On the right panel of each graph, plots depicting the expression of Lamp-1, IFNγ, and CFSE in NK cells purified from a representative healthy donor and a representative melanoma patient are shown. (C) Graphs representing the MFI of T-bet and Eomes on NK cells purified from healthy (n=19) and melanoma donors (n=14). Representative plots are shown (Isotype control: black; HD: unfilled; MD: gray). All experiments were performed in duplicate.

