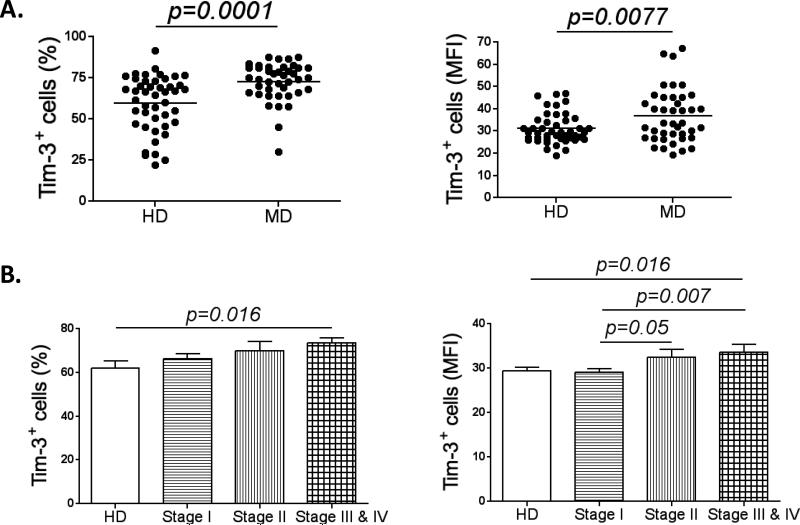
Figure 3. Tim-3 is up-regulated in MD NK cells.
(A) Graph comparing Tim-3 expression in NK cells from healthy donors (HD; n=45) and melanoma patients (MD; n=41). Represented as the percentage of Tim-3+ cells (left panel) and the MFI of the Tim-3+ population (right panel). (B) The graphs show the percentage (left panel) and MFI (right panel) of Tim-3+ NK cells from healthy donors (n=30) and patients with melanoma stage I (n=47), II (n=18) and III/IV (n=18). All experiments were performed in duplicate.

