
Figure 8. Variable strength of IgM signal in J-chain positive and negative spleen cells.
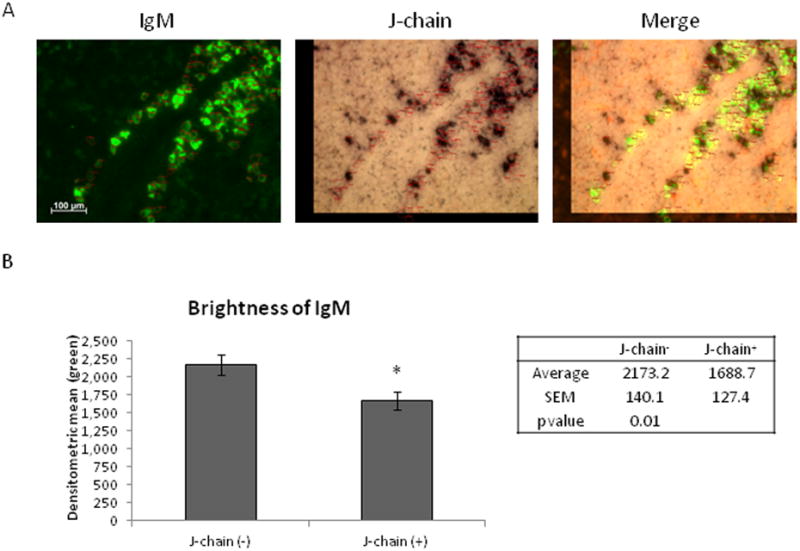
In situ hybridization double stain of 6 μm sections spleen tissue from an adult shark (shark W). (A) Slides were double stained with IgM-C3-C4-DIG (left) and J-chain-FLU (middle) riboprobes. Images merged at right. Photographs taken at 40× magnification and marked with a 100 μm scale bar. (B) Data from 50 cells each of J-chain+ and J-chain- cells (from multiple fields of view) were pooled to get an average mean fluorescent intensity of the IgM stain (green). (*) indicates p-value of less than 0.05 (T-test). Error bars signify SEM.