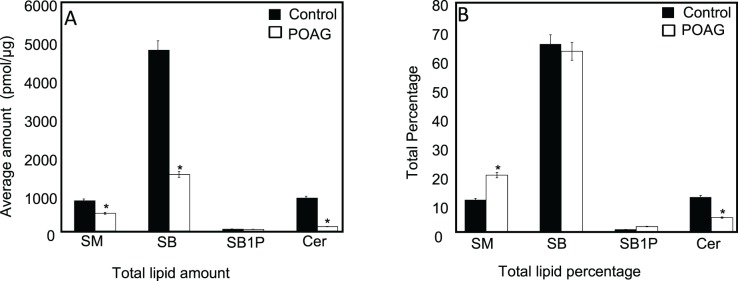
Figure 1.

Composition of sphingolipids and Cers of control (n = 20) and POAG (n = 20) TM samples. (A) Amount of lipid species in pmol/μg of protein for sphingolipids (SM, SB, SB1P, and Cer) as indicated. (B) The same lipid species as in (A) expressed as percentage of total sphingolipids and Cers in each control and POAG TM. Filled and hollow bars represent control and POAG TM as indicated. A 2-tailed t-test was performed to compare quantities of lipids of each class between POAG and control groups. Statistically significant differences were found in lipid classes in POAG compared to control (*P ≤ 0.05).
