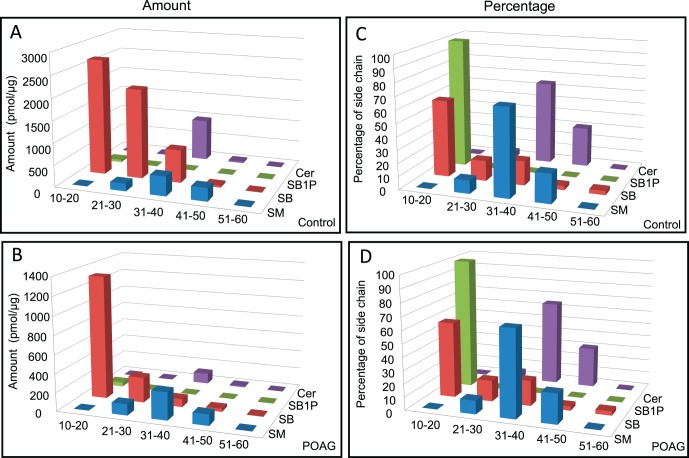
Figure 2.
Composition of side chains of sphingolipids (SM, SB, SB1P, and Cer) in control (n = 20) and POAG (n = 20) TM samples. (A) Amount (pmol/μg of protein) of side chain containing sphingolipids and Cers in the control TM. (B) Amount (pmol/μg of protein) of specific side chain containing sphingolipids and Cers in the POAG TM as indicated. (C) The sphingolipids and Cers side chain in control samples expressed as percent of total lipids (total lipids in SM, SB, SB1P, and Cer classes). (D) The sphingolipids and Cers side chains in POAG samples expressed as percent of total lipids (total sphingolipid and Cers). Symbols are:  SM
SM  SB
SB  SB1P
SB1P  Cer.
Cer.

