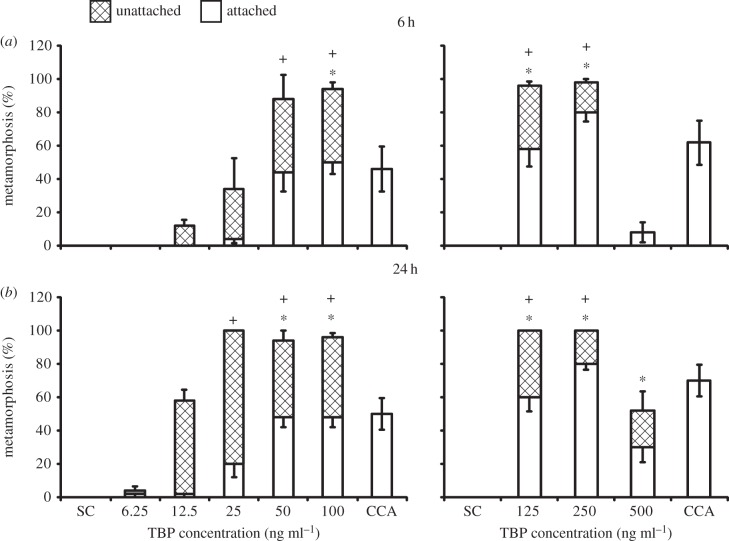
Figure 7.
Response of P. astreoides larvae to different concentrations of TBP after (a) 6 h and (b) 24 h. Hydrolithon boergesenii (CCA) controls were not included in statistical analyses. Bars represent mean percentage metamorphosis after 6 and 24 h including attached (white) and unattached (hatched) larvae (n = 5, 10 larvae per replicate). Error bars represent ±s.e. for total metamorphosis (upper) and attached (lower). There was a significant effect of treatment on settlement and total metamorphosis after both 6 and 24 h according to a one-way ANOVA or ANOVA on ranks (p < 0.001 for each). Symbols above bars represent significant differences (p < 0.05) in settlement (*) and total metamorphosis (+) from the solvent control (SC) according to Dunnett's test.

