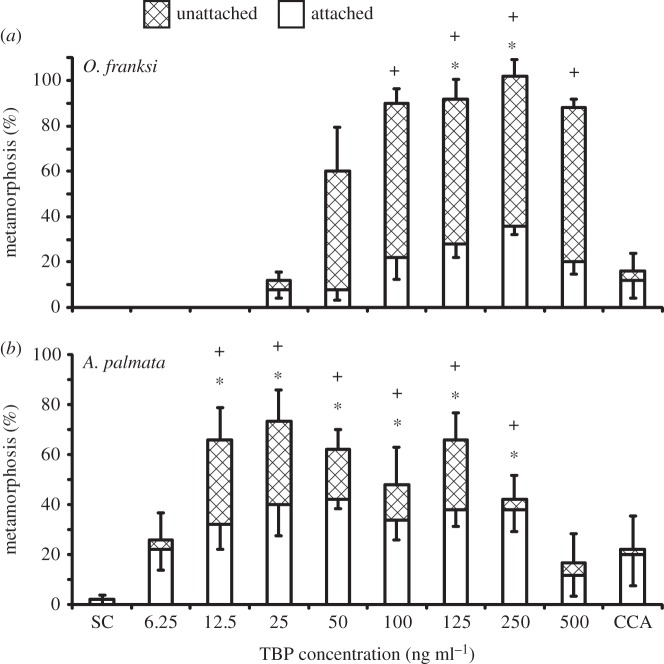
Figure 8.
Response of (a) O. franksi and (b) A. palmata larvae to different concentrations of TBP after 24 h. Hydrolithon boergesenii (CCA) controls were not included in statistical analyses. Bars represent mean percentage metamorphosis after 24 h including attached (white) and unattached (hatched) larvae (n = 5 except for 25 and 500 ng ml−1, n = 6; 10 larvae per replicate). Error bars represent ±s.e. for total metamorphosis (upper) and attached (lower). There was a significant effect of treatment on settlement and total metamorphosis according to a one-way ANOVA or ANOVA on ranks (p < 0.001 for each). Symbols above bars represent significant differences (p < 0.05) in settlement (*) and total metamorphosis (+) from the solvent control (SC) according to Dunnett's test.

