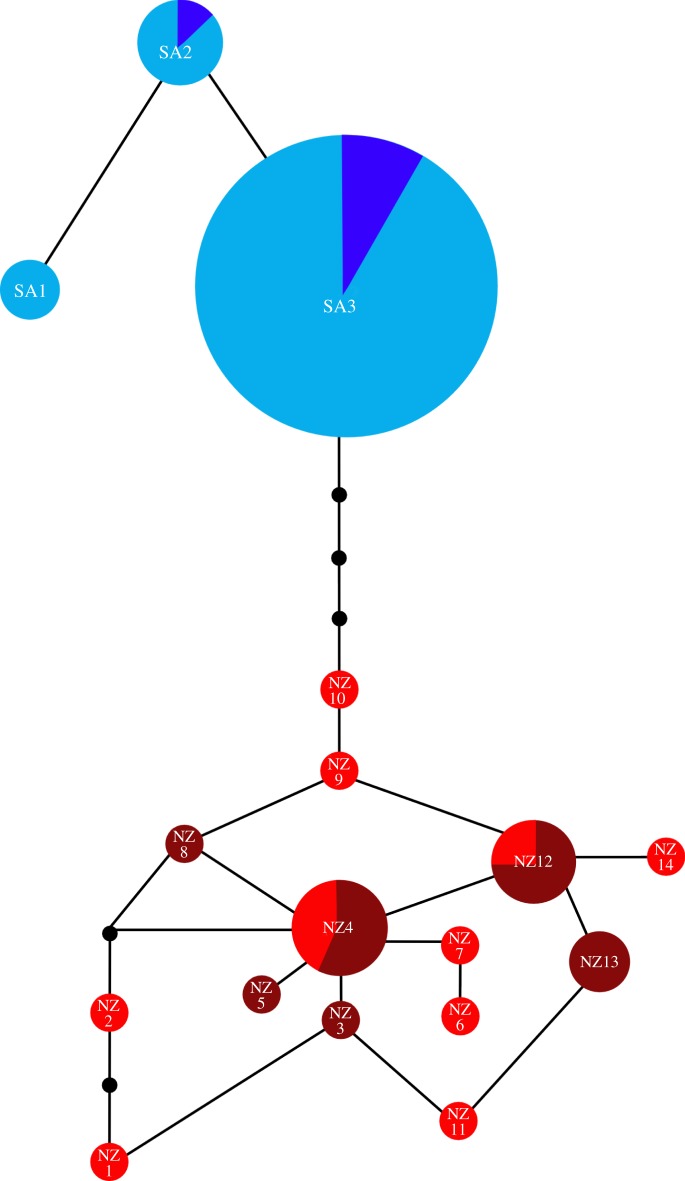
Figure 1.
Haplotype network of mainland (red) and subantarctic (blue) Phocarctos hookeri. Haplotype frequency is indicated by circle area, black dots represent hypothetical intermediate haplotypes. Pie charts within each haplotype represent the proportion of samples of Holocene, archaeological or modern age represented by that haplotype. Naturally deposited Holocene fossils from mainland New Zealand are indicated by dark red, archaeological mainland NZ specimens are light red, archaeological subantarctic specimens are dark blue and modern subantarctic specimens are light blue.

