Figure 2.
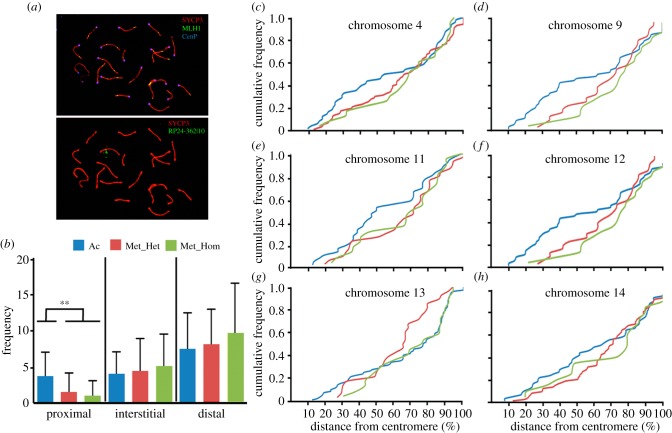
Cumulative frequencies of MLH1 foci in chromosomes implicated in Rb fusions. (a) Sequential image of a mouse spermatocyte at pachynema depicting a triple immunostaining with SYCP3 (red), MLH1 (green) and centromeres (blue) (upper panel) and fluorescent in situ hybridization (FISH; bottom panel) with a BAC probe corresponding to mouse chromosome 11 (RP23–362I10) in green. (b) Representation of the MLH1 foci frequencies obtained after merging data for all chromosomes analysed (no. 4, no. 9, no. 11, no. 12, no. 13 and no. 14). MLH1 foci frequencies along the SCs are shown for three regions depending on the relative distance from the centromere: (i) proximal, from the centromere to 30% of the SC; (ii) interstitial, between 30% and 70% of SC; and (iii) distal, from 70% to telomeric region (Kruskal–Wallis test; **p-value ≤ 0.001). Three different groups were considered: Ac, chromosomes in acrocentric form; Met_Hom, chromosomes involved in Rb fusions in homozygosis; and Met_Het, chromosomes involved in Rb fusions in heterozygosis. (c–h) Cumulative frequency plots representing the CO distribution of specific mouse chromosomes. In all instances, blue lines indicate chromosomes in the acrocentric form (n = 38 cells analysed for no. 4, n = 25 for no. 9, n = 36 for no. 11, n = 31 for no. 12, n = 71 for no. 13 and n = 46 for no. 14). Green lines represent the distribution when chromosomes are involved in Rb fusions in homozygosis (n = 21 cells analysed for no. 4, n = 22 for no. 9 n = 30 for no. 11, n = 21 for no. 12, n = 20 for no. 13 and n = 36 for no. 14) and red lines when in heterozygosis (n = 86 cells analysed for no. 4, n = 22 for no. 9, n = 20 for no. 11, n = 28 for no. 12, n = 26 for no. 13, n = 73 for no. 14).

