Figure 3.
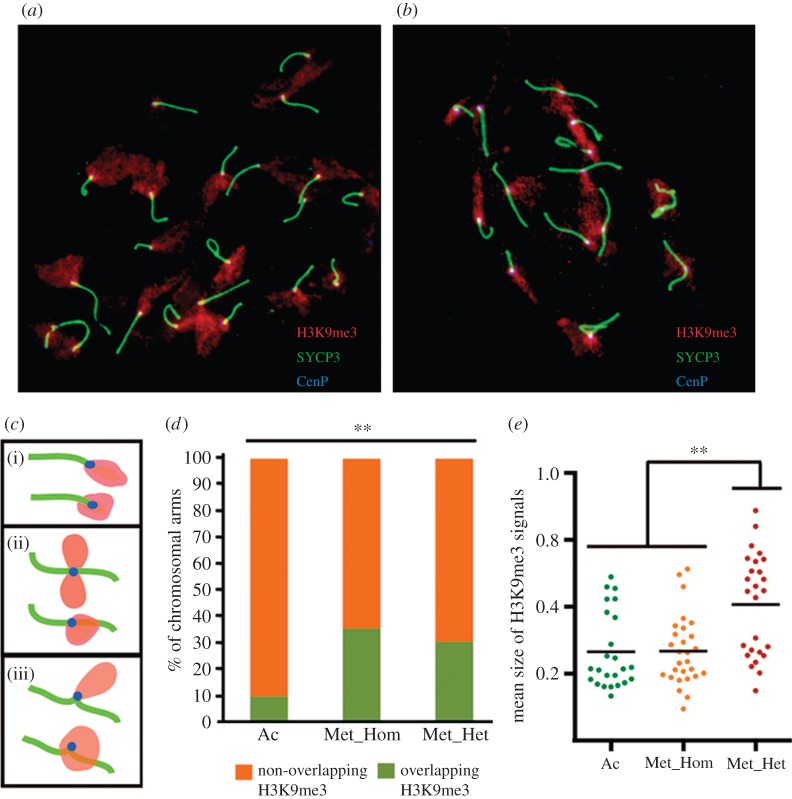
Chromosomal distribution of H3K9me3 signals. (a,b) Examples of mouse spermatocytes from standard (a) and Rb (b) mice displaying the H3K9me3 distribution (red) with SC (green) and centromeres (blue). (c) Representation of the different H3K9me3 signal patterns observed in the sample: (i) acrocentric chromosomes, (ii) heterozygote metacentric, and (iii) homozygote metacentric. In all cases, H3K9me3 signals (red) were found in two different situations: overlapping and not-overlapping the SC. (d) Frequency of chromosomal arms with H3K9me3 signal overlapping (green) or non-overlapping (orange) the SC in acrocentric (Ac, n = 392) homozygote metacentric (Met_Hom, n = 172) and heterozygote metacentric chromosomal arms (Met_Het, n = 71). (e) Distribution of the mean size (expressed in μm of SC length) of the H3K9me3 signals overlapping the SC measured in the centromeric area (n = 78) in the three types of chromosomal arms described in (c,d). Asterisks indicate statistical significance (Fisher's test, **p-value ≤ 0.001; Kruskal–Wallis test, **p-value ≤ 0.001).

