
Figure 1.
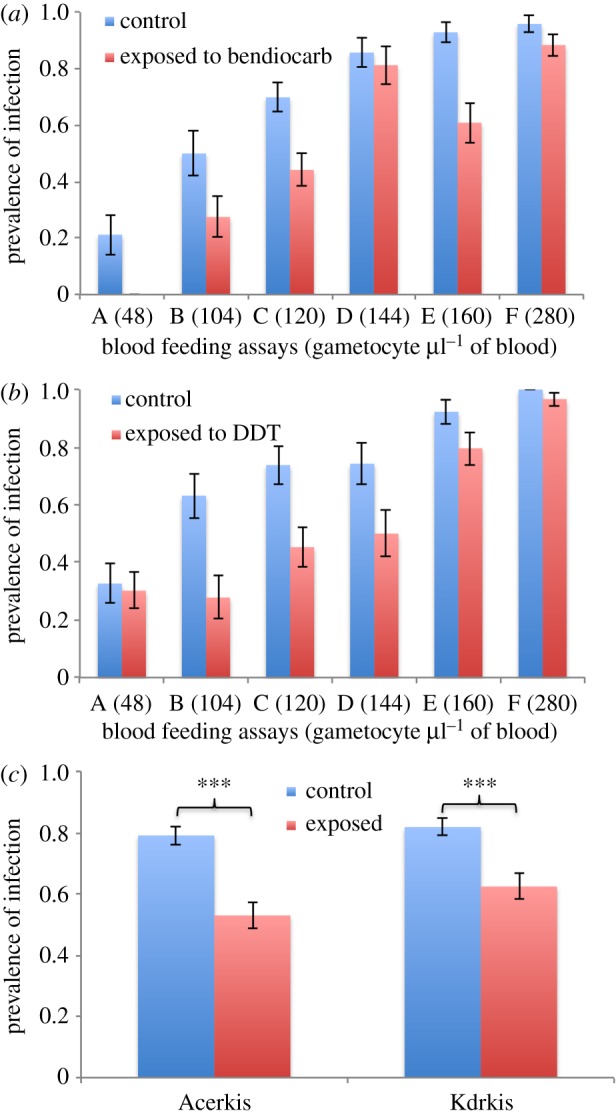
Prevalence of oocyst infection in insecticide exposed and unexposed An. gambiae strains. (a,b) Histograms presenting the prevalence of oocyst-infected females for each Acerkis and Kdrkis strain, respectively, and for each feeding assay. The gametocyte density for each blood donor (per µl of blood) is indicated in brackets. (c) presents the mean prevalence for each insecticide-resistant strain among all six feeding assays. Prevalence of infection in insecticide exposed and control mosquitoes are indicated in red (right hand) columns and blue (left hand) columns, respectively. Bars above and below the means represent the standard errors of the mean. Tests of significance were corrected for multiple testing using the Bonferroni procedure. Asterisks indicate the significance level: *p < 0.05; **p < 0.01; ***p < 0.001. (Online version in colour.)