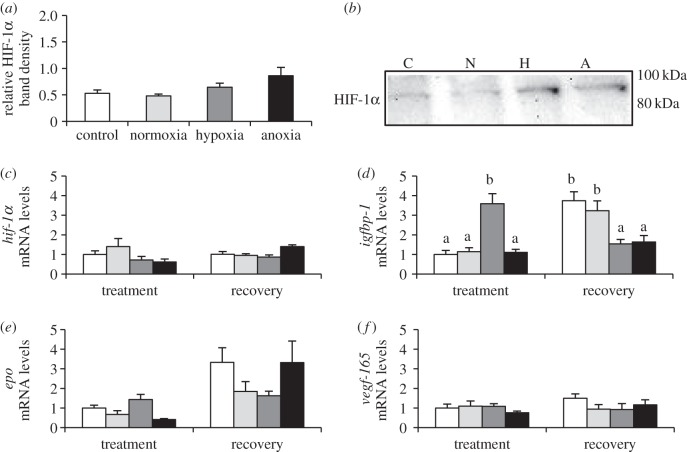
Figure 1.
HIF-1 cellular response of zebrafish (D. rerio) embryos to 4 h of hypoxia (5% DO; H) or anoxia (less than 0.5% DO; A) at 18 hpf. (a) HIF-1α levels relative to total protein immediately following treatment. (b) Representative western blot of HIF-1α protein band at 86 kDa. (c) Hif-1α mRNA and (d–f) HIF-1 target gene mRNA immediately following treatment and after 4 h of recovery at 95% DO. To account for developmental delays caused by low O2 both developmentally matched (control; C) and time-matched (normoxia; N) control groups are included. Values are mean ± s.e.m. (n = 6). Significant differences are indicated by dissimilar letters (one- or two-way ANOVA and Tukey's post hoc test, p < 0.05).

