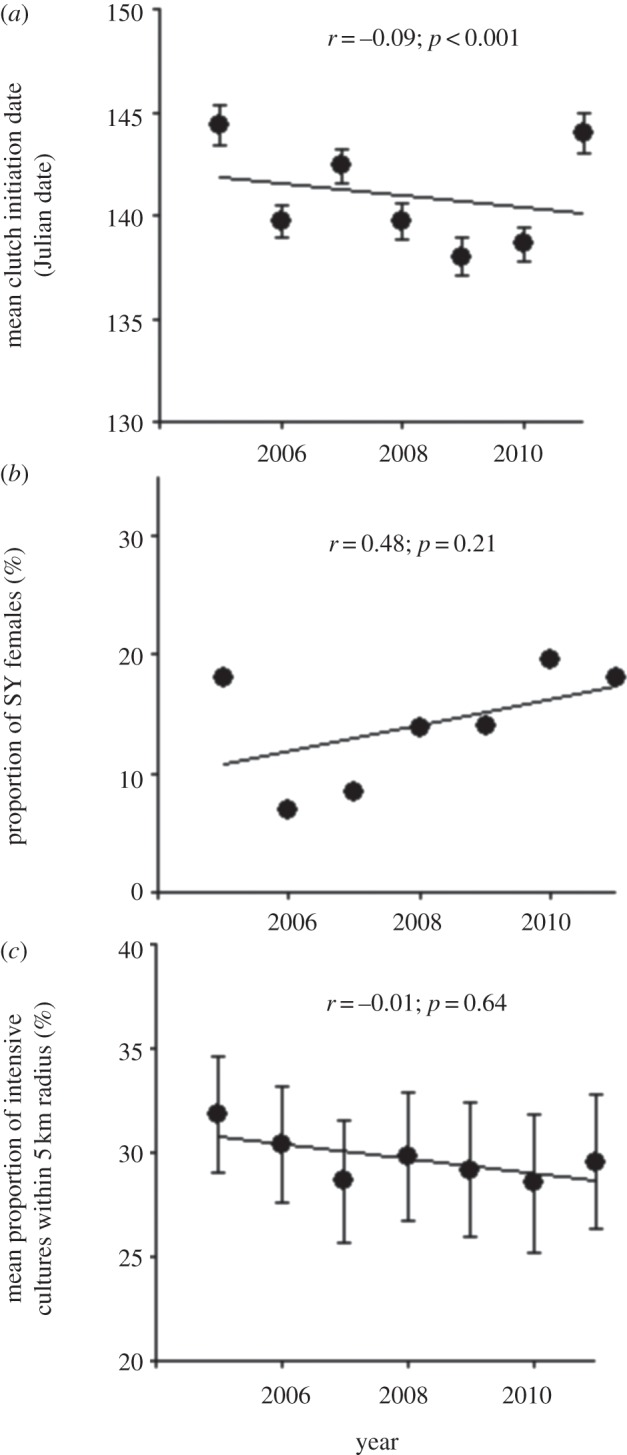
Figure 3.

Variation in other covariates of tree swallow body mass considered in this study: (a) mean laying date; (b) proportion of SY, as opposed to ASY females in the adult female population and (c) mean proportion of intensive cultures within 5-km radius of occupied nest-boxes. Error bars indicate 95% CIs of mean values and linear correlations (r) were calculated on the raw data except for the proportion of SY females (b), for which it was calculated on annual population means.
