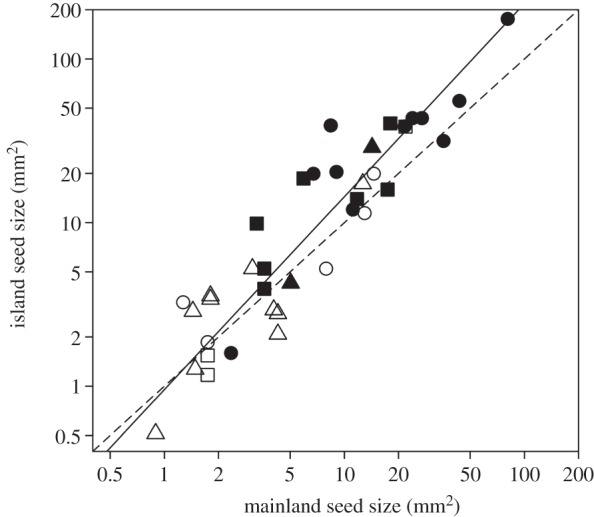
Figure 2.

Relationship between island and mainland seed size. Each point represents a taxonomic pairing between an insular taxon and its corresponding mainland relative. Circles represent trees, squares are shrubs, and triangles are herbs. Closed symbols indicate fleshy-fruited taxa and open symbols dry-fruited. The dashed line represents isometry and the solid line is the result of RMA regression (y = 1.180x − 0.021). Both axes are logarithm transformed.
