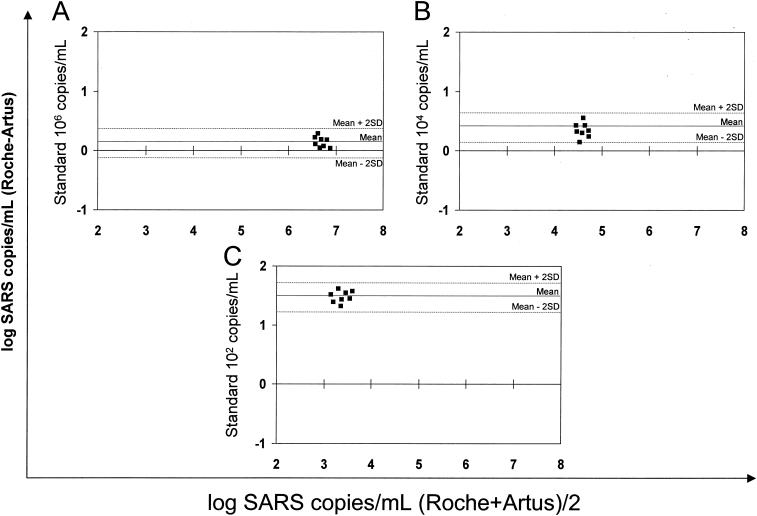
FIG. 4.
Limits of agreement according to Bland and Altman (4). The means of both methods (x axis) were plotted against the differences between the means of the two methods (y axis). (A) External standard RNA concentration of 106 copies/ml; (B) external standard RNA concentration of 104 copies/ml; (C) external standard RNA concentration of 102 copies/ml. The mean is indicated by a solid line; the means ± two times the SD (2SD) are indicated by dotted lines.

