
Figure 2.
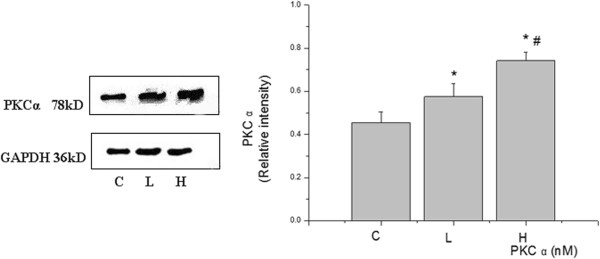
Expression of PKC α in different tidal volume ventilation groups (Western blotting). (C) control group, (L) low tidal volume group, (H) high tidal volume group. The low tidal volume was 7 ml/kg; the high tidal volume was 42 ml/kg. The density of proteins in the control group was used as a standard to compare relative densities in the other groups. *P <0.05 vs. control. #P <0.05 vs. group L. Data are representative of three independent experiments. Results are means ± standard error.