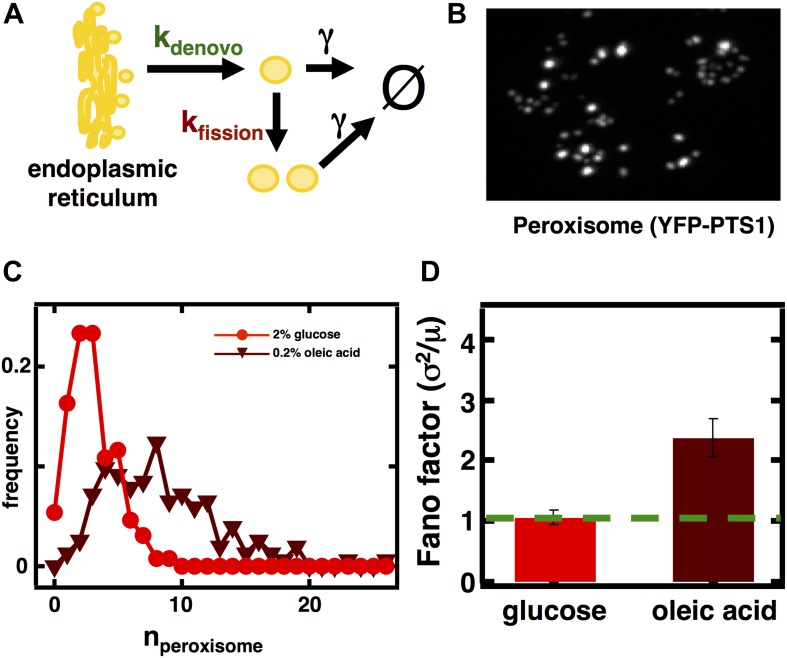
Figure 3. Inferring the dominant biophysical pathways in peroxisome biogenesis.
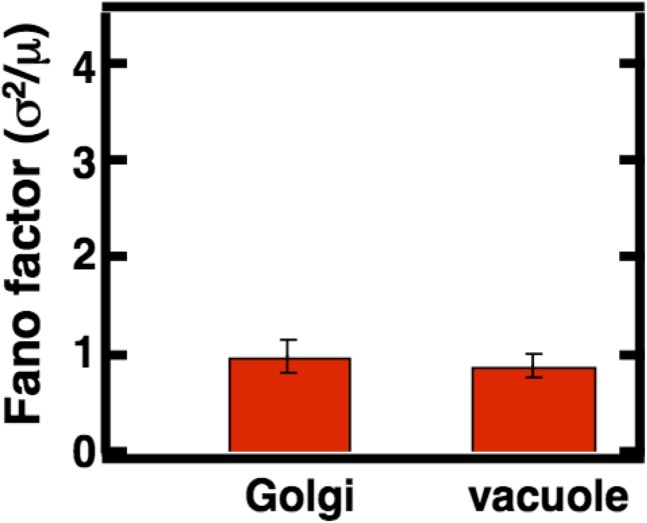
(A) Schematic depicting the biophysical processes that govern peroxisome abundances. (B) Spinning disc confocal microscopy images of the peroxisome as visualized by the fusion protein YFP-PTS1-mRFP. (C) Histograms depicting experimentally measured single cell peroxisome abundance distributions for haploid cells grown in 2% glucose (red circles) and haploid cells grown in 0.2% oleic acid (dark red triangles). N = 129 cells were analyzed in glucose medium and N = 153 cells were analyzed in oleic acid medium. (D) Bar graph depicting measured peroxisome abundance distribution Fano factors in glucose-rich and 0.2% oleic acid-rich media. The green dashed line indicates a Fano factor σ2/<n> = 1, marking the boundary between de novo synthesis and fission dominated organelle production. Figure 3—figure supplement 1 depicts a peroxisome biogenesis model, referred to as Model 2, alternative to the model depicted in panel (A). Figure 3—figure supplement 2 depicts data similar to panels (B–D) but with Pex3-mRFP as the peroxisome marker. Figure 3—figure supplement 3 displays simulation results from Model 2 showing how increased pre-peroxisomal vesicle production affects the mean and Fano factor of the mature peroxisome abundance distribution. Figure 3—figure supplement 4 depicts the Fano factors of the Golgi apparatus and vacuole abundance distributions from cells grown in oleic acid-rich medium. Error bars are ±1 standard error of the mean, estimated by bootstrapping.
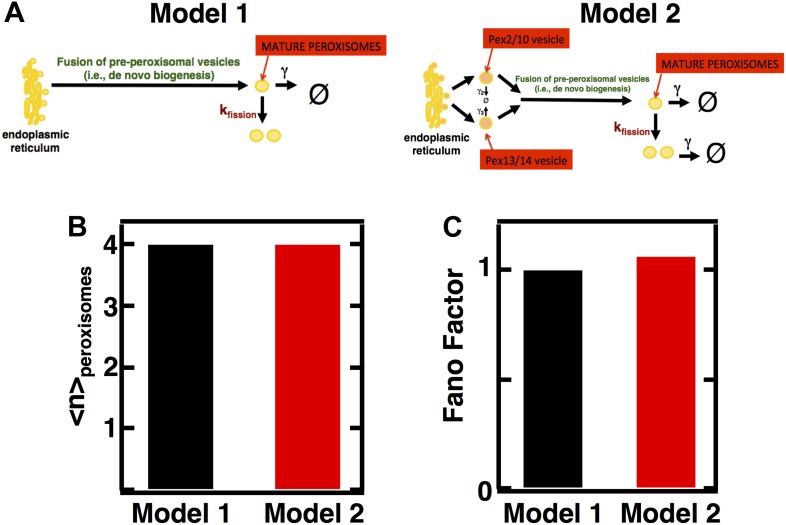
Figure 3—figure supplement 1. Incorporating pre-peroxisomal vesicle fusion into the model of de novo peroxisome biogenesis.
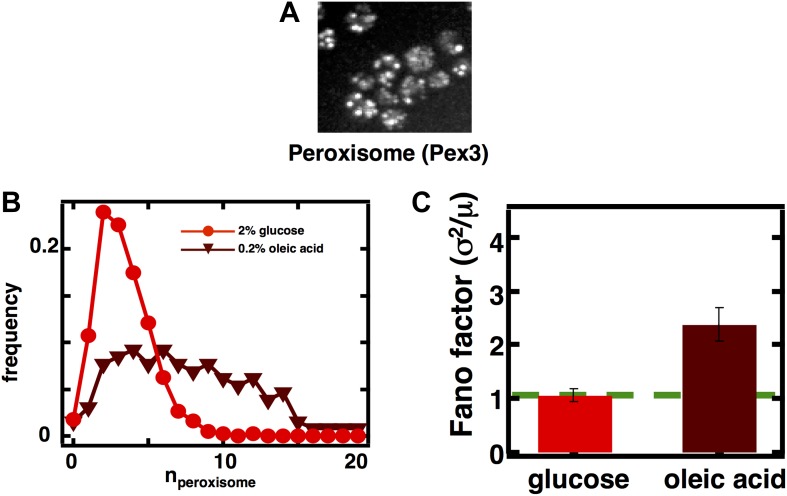
Figure 3—figure supplement 2. Measuring mature peroxisome abundance statistics using Pex3-mRFP as the peroxisomal marker.
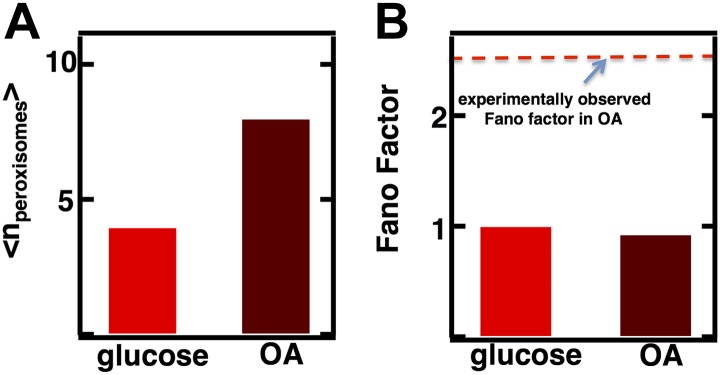
Figure 3—figure supplement 3. Predicting stochastic fluctuations in peroxisome abundance distributions in budding yeast cells synchronized and arrested in S-phase of the cell cycle.
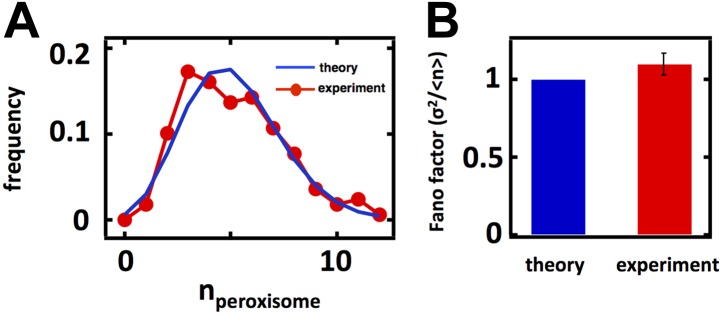
Figure 3—figure supplement 4. Effect of increasing pre-peroxisomal vesicle production in Model 2 on mean and mature peroxisome abundance distribution Fano factors.
