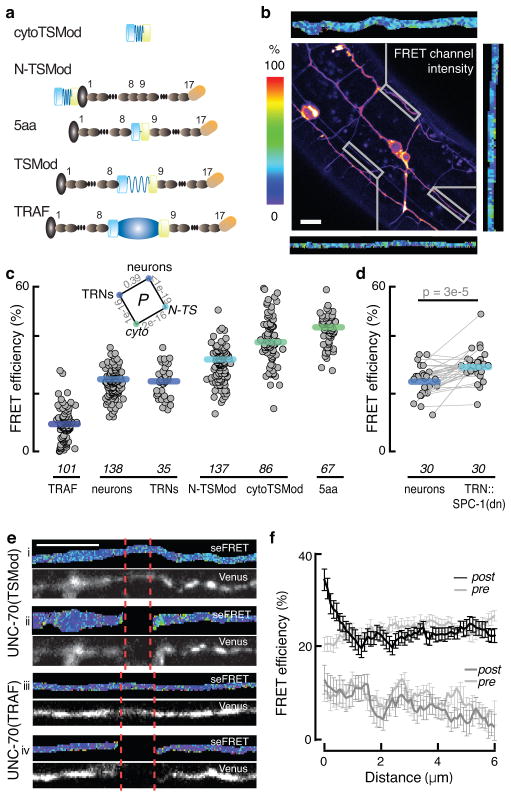
Figure 5. UNC-70 is under constitutive tension in neurons of living animals.
a, TSMod-UNC-70 β-spectrin fusion proteins. Shown schematically in descending order of expected FRET efficiency (top to bottom): cytoTSMod, N-TSMod, 5aa, UNC-70(TSMod), and TRAF. Symbols are: mTFP, teal cylinder; spider silk linker, blue spring; Venus, yellow cylinder; UNC-70 actin binding domain, gray oval; spectrin repeats, charcoal oval; TRAF domain, dark blue oval.
b, Representative confocal image of the uncorrected FRET channel after mTFP donor excitation and recording the Venus acceptor emission. Scale bar: 10 μm. Flanking the image are images of FRET efficiency for three ROIs.
c, FRET efficiency of the TSMod fusion proteins illustrated in a. TRNs were identified based on their distinctive morphology and position. CytoTSMod and N-TSMod are no-force controls, while UNC-70(TRAF) and UNC-70(5aa) are low and high FRET controls. Each point corresponds to the mean FRET efficiency of a single ROI; thick bars are the median values across ROIs; data collected during eight imaging sessions. Distributions were normal (Jarque-Bera test) and inset shows p-values derived from t-tests for the indicated combinations. The sample size required to estimate the minimal difference between UNC-70(TSMod) and the no-force controls is 15 at the level of α=0.01. The minimum detectable difference for the presented data is δ=1.7%.
d, FRET efficiency in TRNs and nearby neurons in TRN::SPC-1(dn) transgenics. Lines connect neuron pairs measured in the same animal. p value (paired U-test) is shown above.
e, Laser axotomy increases UNC-70(TSMod) FRET adjacent to the cut site. Panels i-iv show representative micrographs of TRNs before (i, iii) and after (ii, iv) axotomy in animals expressing UNC-70(TSMod) (i, ii) or UNC-70(TRAF) (iii, iv). Each pair of micrographs shows the FRET efficiency (top) and acceptor fluorescence (bottom). The color scale is the same as in b and c.
f, FRET efficiency as a function of distance from the cut site. Points are the mean (±SEM) of 23 and 17 axotomies for each UNC-70(TSMod) and UNC-70(TRAF), respectively. Neurites were imaged at the same position prior to axotomy (gray traces, pre). As expected for an axotomy-induced tension release, FRET was highest near the cut site and declined to control values within 2μm. Data collected during n=3 imaging sessions.

