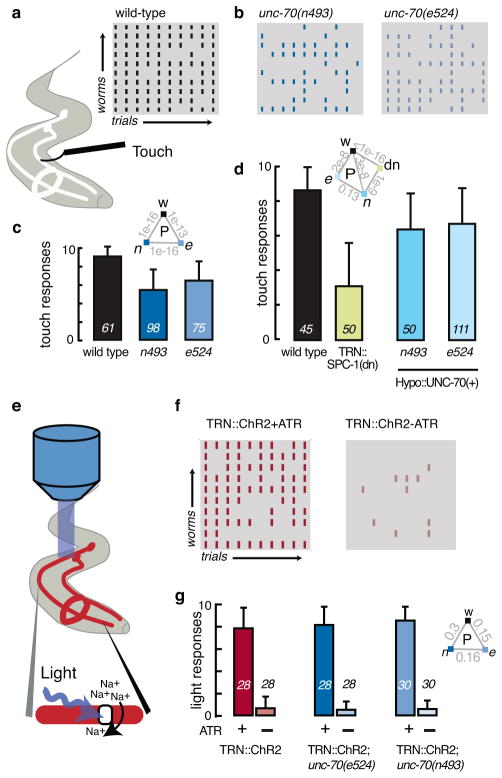
Figure 6. Loss of unc-70 function impairs touch sensitivity, but not synthetic light sensitivity.
a–d, Touch response in wild-type and unc-70 mutants.
a, Schematic of the assay used to measure touch sensitivity41 and ethogram of touch responses in wild-type (N2). Rows represent individual worms, columns are trials, and black tics indicate a stimulus-evoked reversal. (Gray tics indicate trials that failed to elicit a detectable response.)
b, Ethogram of unc-70(n493) and unc-70(e524) mutant animals.
c, Average touch response as a function of genotype. Bars are mean ± s.d., numbers on each bar shown the number of animals tested blind to genotype during four assay sessions; inset shows p values derived from a U-test.
d, Average response rate in transgenic animals with TRN-specific defects in spectrin function (TRN::SPC-1(dn)) or hypodermis-specific expression of wild-type UNC-70. Bars are mean ± SD, numbers on each bar show the number of animals tested blind to genotype during n=2 or n=4 assay sessions for TRN::SPC-1(dn) and unc-70; HYPO::UNC-70(+) transgenics, respectively; inset shows p values derived from a U-test.
e–g, Light-induced reversal in transgenic animals expressing ChR2 selectively in the TRNs (TRN::ChR2).
e, Schematic of optogenetic stimulation.
f, Ethogram of the response of TRN::ChR2 control animals to blue light in presence (left) and absence (right) of all-trans retinal, ATR.
g, Average light response in control and unc-70 mutants grown in the presence (green, blue bars) or absence of ATR (gray bars) and stimulated with brief (1s) light pulses of 0.48 mW·mm−2. Bars are mean ± SD, number of animals tested during n=2 independent assay sessions is indicated near each bar; inset shows p values derived from a Mann-Whitney U-test.

