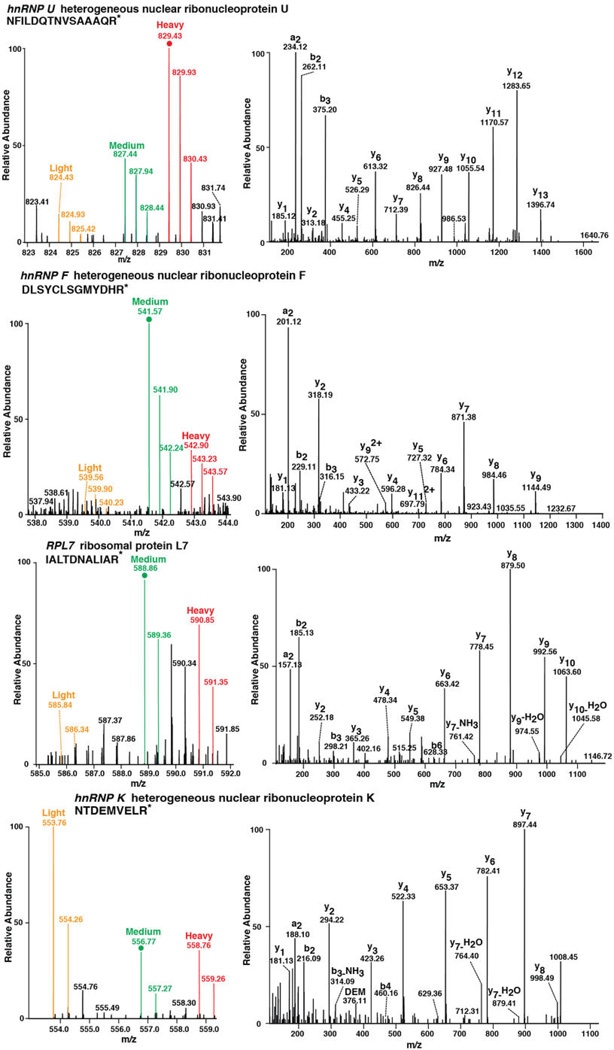
Extended Data Figure 6. Example of mass spectrometry spectra using SILAC obtained from the eluted fractions from the RNA pulldown.
Four sets of spectra representing unique peptide sequences identified for hnRNP U, hnRNP F, RPL7, and hnRNP K show the quantitative RNA structural preferences that can be identified by using the SILAC methodology. In agreement with the work presented in Figure 3, each protein represented by the unique peptide spectrum here shows an individual preference for either RNA structure dependence, such as NCL (Figure 3) and hnRNP U, or sequence dependence, as in the cases of hnRNP K, hnRNP F, and RPL7, as shown by the abundance of the different isotope labels provided by the SILAC method. In Supplementary Table S1, the quantified differences are provided.

