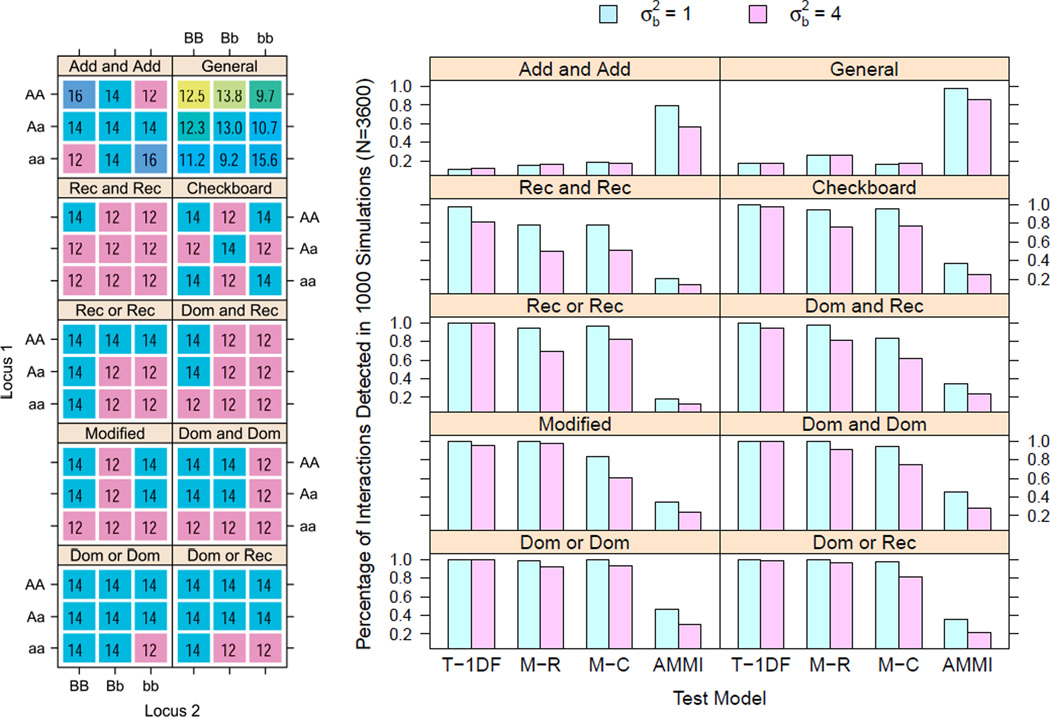
Figure 5.
Number of interactions detected (or null hypotheses of no interaction rejected) by each of the four tests in 1000 simulated datasets under 10 common epistasis models. The true models with cell means are displayed in different colors on the left hand panel. The top label within each box represents the true simulation model whereas the horizontal axis labels indicate the tests. carried out The error variance is set at 4 in all cases. Simulation settings are described in Section 6.2.

