
Figure 1.
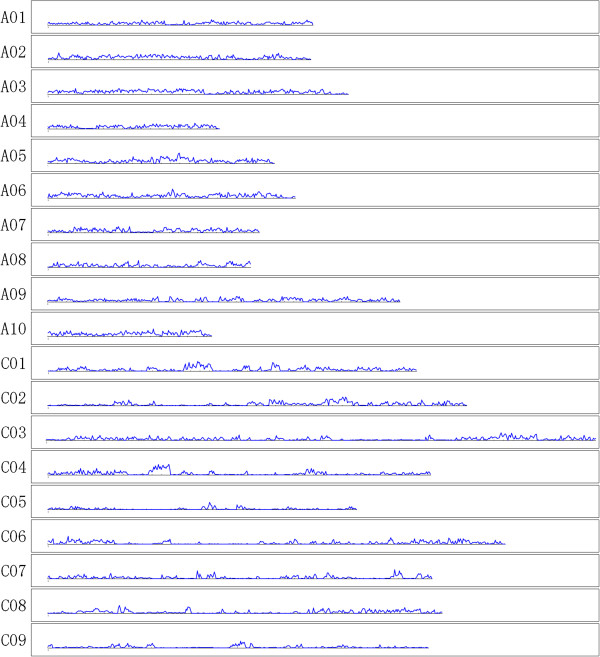
Distribution graph for SNPs discovered in the Brassica napus A and C genomes. The X axis represents the length of the chromosome while the Y axis represents the number of SNPs present at that point on each chromosome.
Official websites use .gov
A
.gov website belongs to an official
government organization in the United States.
Secure .gov websites use HTTPS
A lock (
) or https:// means you've safely
connected to the .gov website. Share sensitive
information only on official, secure websites.
Distribution graph for SNPs discovered in the Brassica napus A and C genomes. The X axis represents the length of the chromosome while the Y axis represents the number of SNPs present at that point on each chromosome.