
Figure 2.
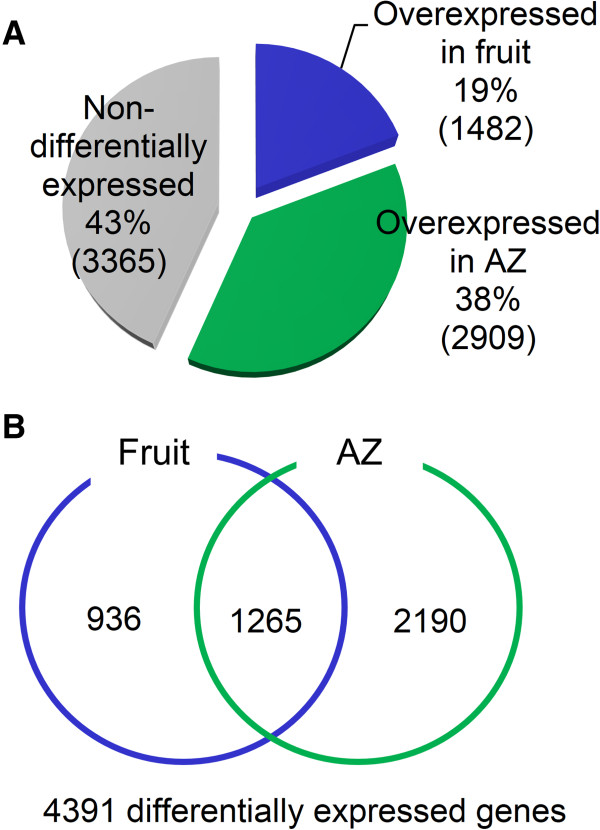
Distribution of genes differentially expressed between olive ripe fruit and its AZ at 217 DPA. (A) The number and percentages of overexpressed genes by tissue: olive fruit and AZ at late stage of ripening. (B) Overlap of overexpressed fruit genes and overexpressed AZ genes. This figure shows the number the transcripts that were specific for each tissue.