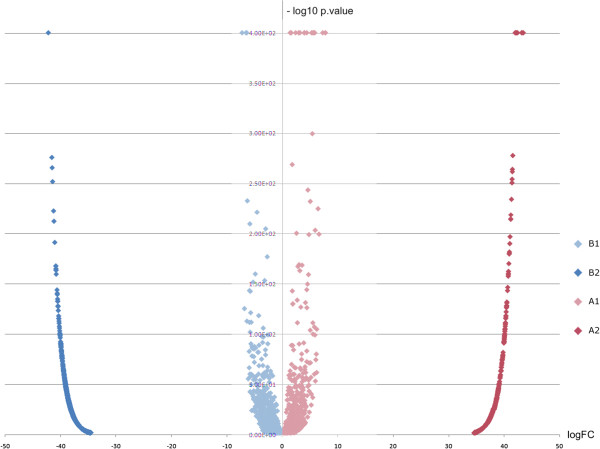
Figure 3.

Volcano blots show significant changes in gene expression between fruit and AZ tissues at 217 DPA. Dispersion graph of the–log10 p value (y axis) against the logFC (x axis) corresponding to the genes clustered by their differential expression: A1 (fruit-enriched genes), A2 (fruit genes), B1 (AZ-enriched genes) and B2 (AZ genes). Fold changes and their associated P values for all probe sets can be found in Additional file 7.
