Figure 7.

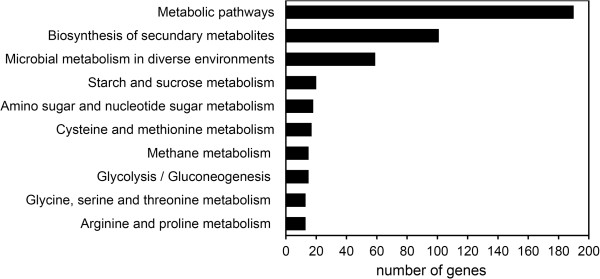
Histogram illustrating pathway enrichment analyses. Distribution of the number of differentially expressed genes between ripe fruit and AZ tissues in different metabolic pathways.

Histogram illustrating pathway enrichment analyses. Distribution of the number of differentially expressed genes between ripe fruit and AZ tissues in different metabolic pathways.