
Figure 3.
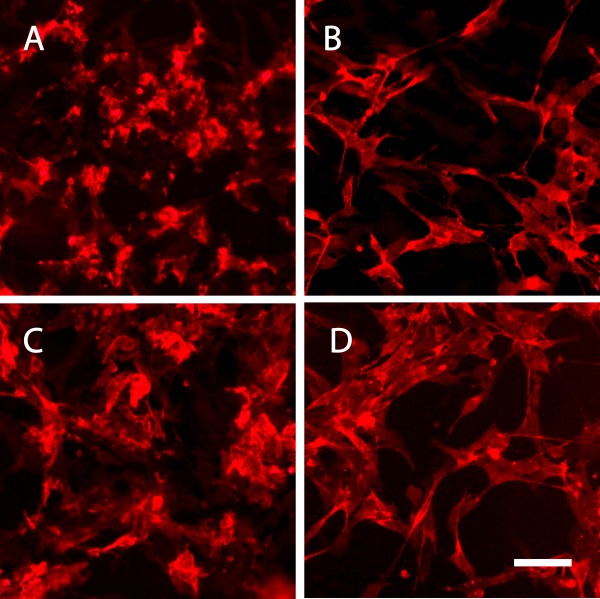
Fluorescence micrographs of NG2+HOPCs stained for NG2. Images show A) NG2+HOPCs after 18 h exposure to 10 μM Aβ1–42 oligomers. B) NG2+HOPCs after 18 h exposure to Aβ1–42 oligomer vehicle. C) NG2+HOPCs after 18 h exposure to 10 μM Aβ1–42 fibrils. D) NG2+HOPCs after 18 h exposure to Aβ1–42 fibril vehicle Scale bar = 25 μm.