
Figure 1.
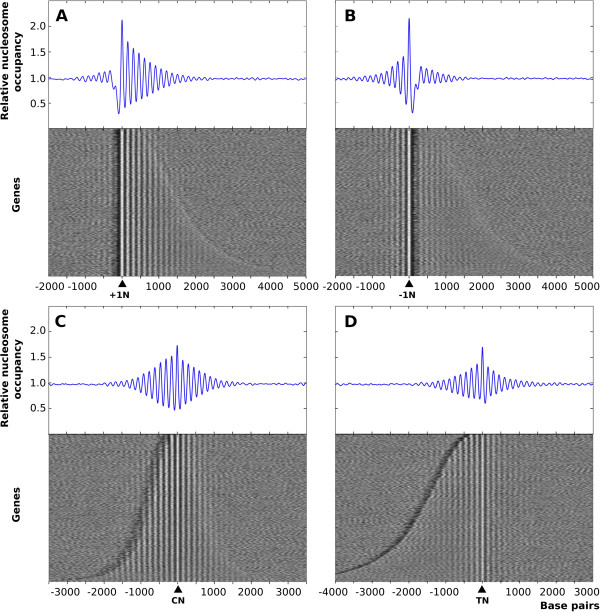
Nucleosome profile of transcribed and intergenic regions in S. pombe. The nucleosome profile of approximately 4000 S. pombe genes was aligned relative to the midpoint position of the +1 (+1 N) (A), -1 (−1 N) (B), central (CN) (C) and terminal (TN) (D) nucleosomes of each transcription unit. Genes are arranged by increasing size from top to bottom. Blue diagrams represent the relative nucleosome occupancy of the aggregated nucleosome profiles in the panels below. The data shown are from exponential mitotic diploid pat1.114 cells.