
Figure 2.
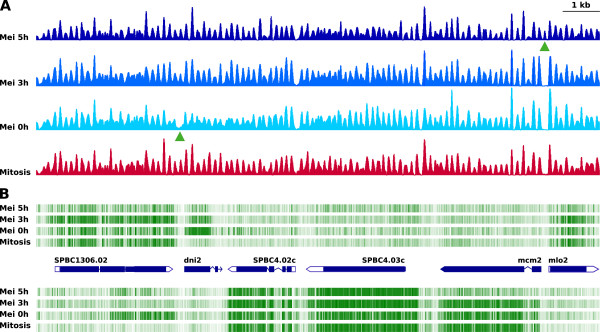
Nucleosome dynamics and transcription during mitosis and meiosis. (A), Nucleosome patterns across 15 kilobases of the S. pombe genome from exponential diploid pat1.114 cells (red) and from the same cells at the indicated times during synchronous meiosis (different shades of blue). Green arrowheads point to a nucleosome missing in meiosis at 0 h and to another present only in meiosis at 5 h. (B), Strand-specific transcriptional profile generated by tiling microarrays. The intensity of the green lines correlates with the level of expression. Blue pointed rectangles represent genes where the coding (blue) and non-coding (white) regions are indicated. The absence or presence of the two nucleosomes in panel (A) (green arrowheads) correlates with the up- or down-regulation of the adjacent transcripts at 0 h and 5 h of meiosis, respectively.