
Figure 7.
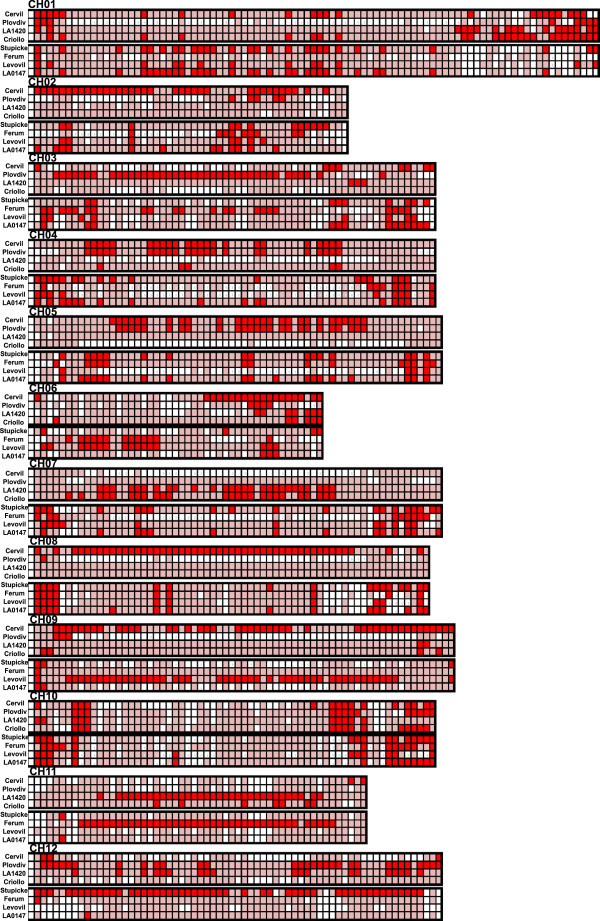
Single nucleotide polymorphisms (SNP) variation across the genome in the two groups of four cherry-type tomato lines (Cervil, Plovdiv, LA 1420, Criollo from top to bottom) followed by the four cultivated lines (Stupicke, Ferum, Levovil and LA 0147 from top to bottom). The x-axis represents the physical distance along the chromosomes, in which each tick-mark is one megabase. For each chromosome, the regions with extremely low SNP frequencies (less than 20% of the SNP from the group of four lines) are shown in white, and the regions with the 20% highest density of the SNPs (per group of four lines) are shown as red blocks.