Figure 6.

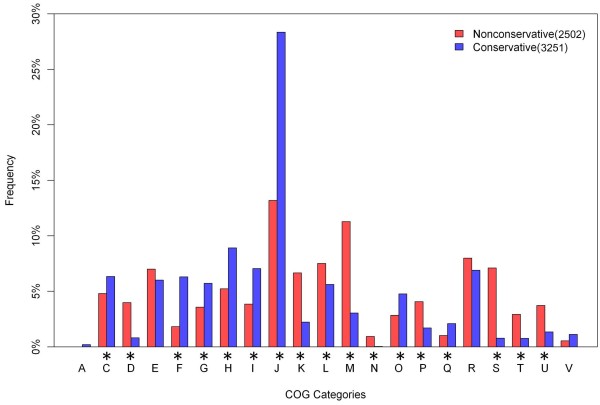
Different COG functional category distributions between groups conserved and non-conserved in humans. The * symbol signifies that the category has a significant difference between the two groups (Z-test, P < 0.01).

Different COG functional category distributions between groups conserved and non-conserved in humans. The * symbol signifies that the category has a significant difference between the two groups (Z-test, P < 0.01).