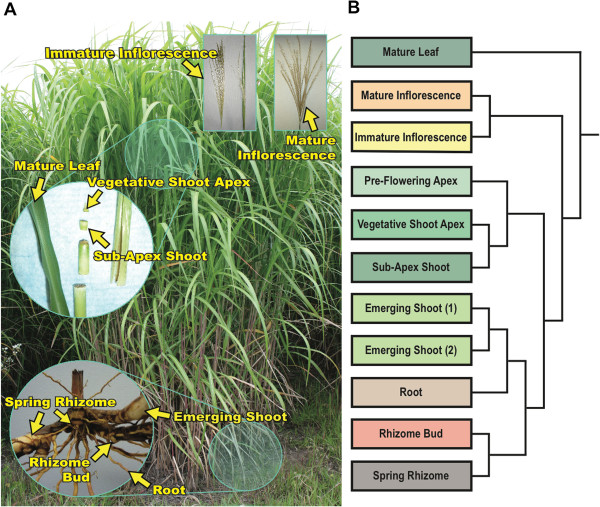
Figure 1.

Sampled Miscanthus × giganteus tissue types and relatedness of EST profiles using Sorghum bicolor gene models as references. Panel A is an image identifying many of the M. × giganteus tissues used in this study. Panel B displays the relatedness of the sequenced tissue types by hierarchical clustering of the expression profiles using Manhattan distance and complete linkage.
