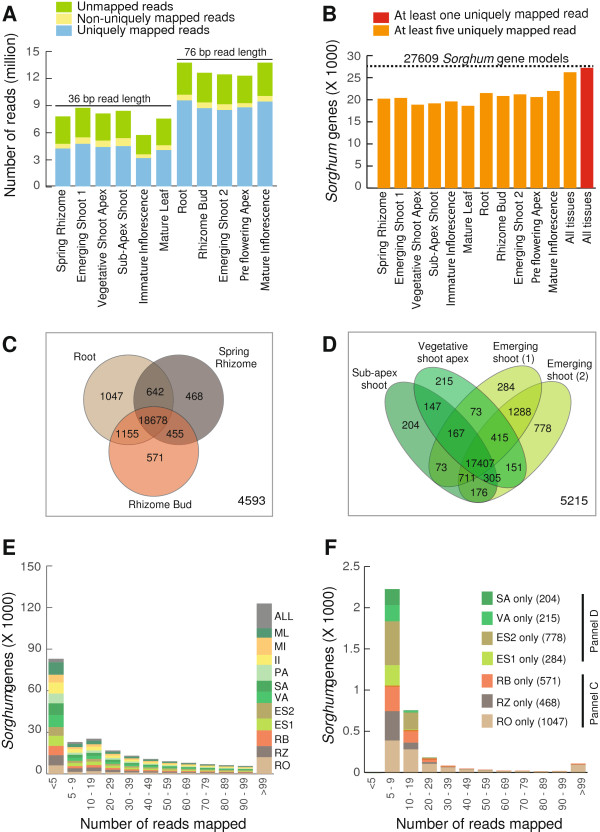
Figure 2.

Reads from each Miscanthus tissue mapped to Sorghum bicolor. Panel A displays read count matching to S. bicolor gene models for each sequenced M. × giganteus tissue uniquely, non-uniquely (i.e., between two and five matches), or not at all; approximately 53% to 71% of the M. × giganteus reads mapped uniquely to the Sorghum transcripts. Panel B shows the number of Sorghum gene models represented by a minimum of five M. × giganteus reads for each sequenced M. × giganteus tissue. Panels C and D show similarities and differences in the profiles of Sorghum gene models represented with a minimum of five reads for select M. × giganteus tissues. Panel E shows a histogram of the total number of reads mapped per Sorghum gene model for each M. × giganteus library. Panel F shows the distribution of the number of reads mapped per Sorghum gene model in the unique categories of the Venn diagrams in panels C and D.
