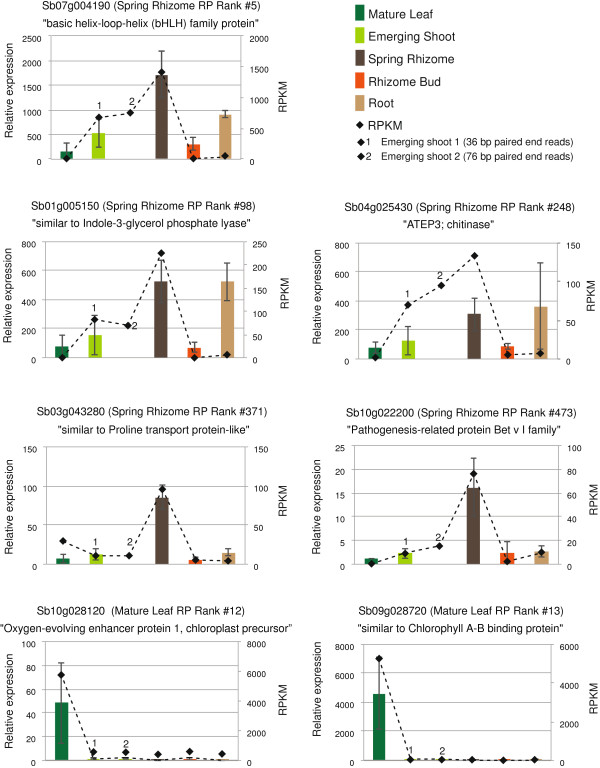
Figure 3.

Verification of differentially expressed genes. Comparison of RPKM data and RT-qPCR results for five separate M. × giganteus tissue types. RPKM values are shown as dashed lines with values on the right y-axis. Relative expression via RT-qPCR is shown as bars with values on the left y-axis.
