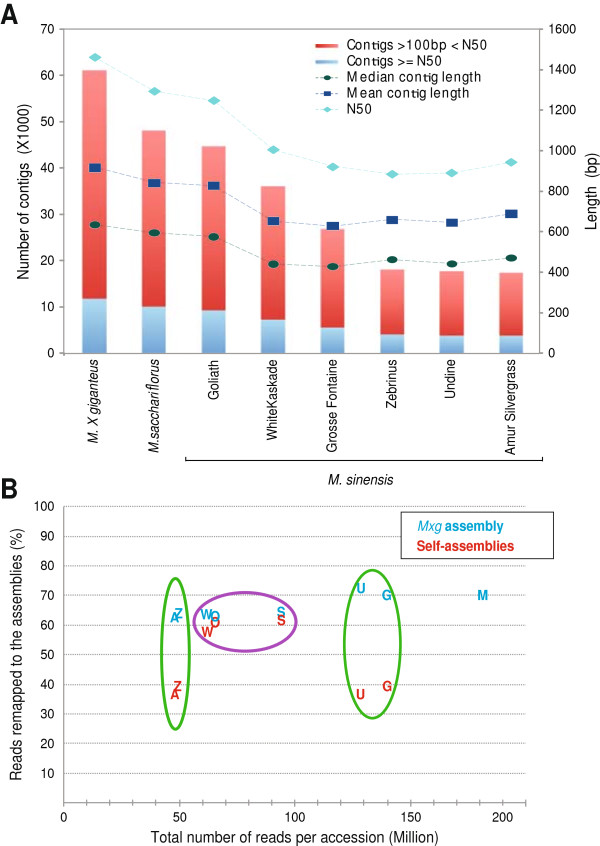
Figure 4.

Basic assembly statistics for the transcriptomes from eight Miscanthus accessions. Panel A compares assembly statistics for each accession. Height of bars indicates number of contigs (left Y-axis) and lines represent length of contigs (right Y-axis). Panel B shows the number of reads from each accession (indicated by letters) which mapped back to either the assembly produced from that specific accession (red letters) or to the more complete assembly derived from all sequenced M. × giganteus libraries (blue letters). The assemblies from individual accessions where a mixture of tissues were combined into one RNA-Seq library are contained within the purple circle, whereas those assemblies derived from only leaf tissue are contained within the green circles. Mapped reads from each accessions are denoted as follows: “Z” M. sinensis ‘Zebrinus’, “A” M. sinensis ‘Amur Silvergrass,’ “W” M. sinensis ‘White Kaskade,’ “O” M. sinensis ‘Goliath,’ “S” M. sacchariflorus ‘Golf Course,’ “U” M. sinensis ‘Undine,’ “G” M. sinensis ‘Grosse Fontaine,’ and “M” is M. × giganteus.
