Figure 5.

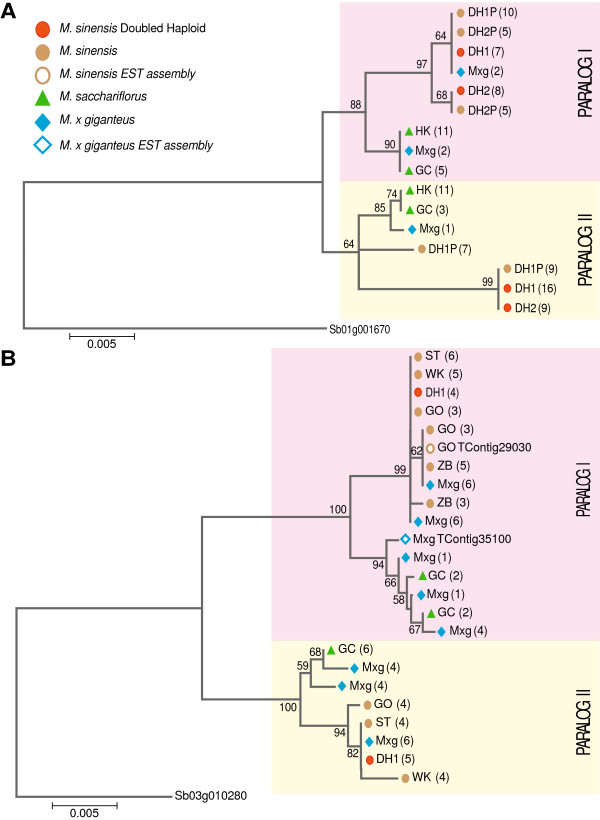
Evolutionary relationships among Miscanthus gene fragments. Maximum likelihood trees were generated for two genes; significant branches are denoted by their bootstrap value. The trees are drawn to scale, with branch lengths measured by the number of substitutions per site. Panel A displays a tree drawn from the alignment of a 691 bp genomic sequence homologous to Sb01g001670, which is a single copy gene annotated as a putative membrane component member of the ER protein translocation complex. Panel B displays a tree drawn from the alignment of a 1,097 bp exonic segment of Sb03g010280, similar to Cycling DOF Factor 1 (CDF1). The Miscanthus EST contigs (M × g TContig35100 and GO TContig29030) are also included in the tree. Abbreviations for accession names: M. sinensis ‘IGR-2011-001’ (DH1), M. sinensis ‘IGR-2011-002’ (DH2), M. sinensis ‘IGR-2011-003’ (DH1P), M. sinensis ‘IGR-2011-004’ (DH2P), M. sacchariflorus ‘Hercules’ (HK), M. sacchariflorus ‘Golf Course’ (GC), M. sinensis ‘Goliath’ (GO), M. sinensis ‘Silbertum’ (ST), M. sinensis ‘White Kaskade’ (WK), and Miscanthus × giganteus (M × g).
