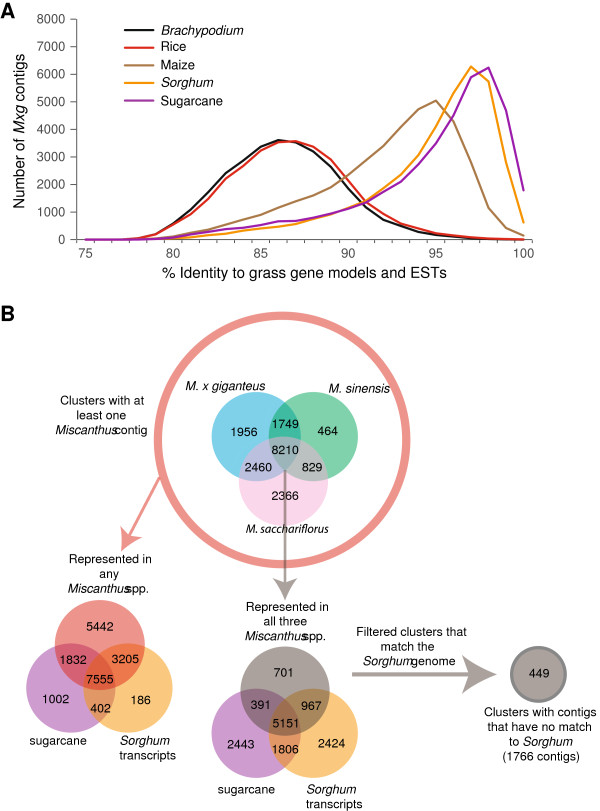
Figure 6.

Comparison of the assembled Miscanthus transcripts to gene models and ESTs of other grasses. In Panel A, Miscanthus × giganteus EST contigs were compared to Sugarcane transcripts (purple), and gene models of Sorghum bicolor (orange), Zea mays (brown), Oryza sativa (red) and Brachypodium (black). The graph shows the number of contigs that match each grass transcript dataset with a given percent nucleotide identity. Panel B represents the clustering of Miscanthus contigs with Sorghum bicolor gene models and contigs from the Sugarcane assembled EST database (SOGI). In total, 449 clusters contain at least one Miscanthus contig with no match in Sorghum bicolor or in the SOGI database at 90% identity over 90% of its length.
