
Figure 2.
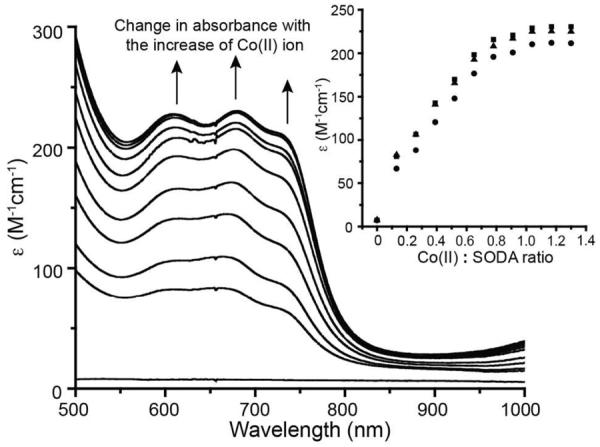
UV-vis spectrum of Co-SODA (solid line), partially oxidized Co-SODA (dotted line, 30 minutes of air oxidation), completely oxidized Co-SODA (dashed line, 24 hours of air exposure) All solutions are in aqueous 50 mM NEM buffer at pH 7.5. The inset shows an enlargement of the region between 500 and 1000 nm featuring bands associated with ligand field (LF) transitions for reduced Co-SODA.