
Figure 3.
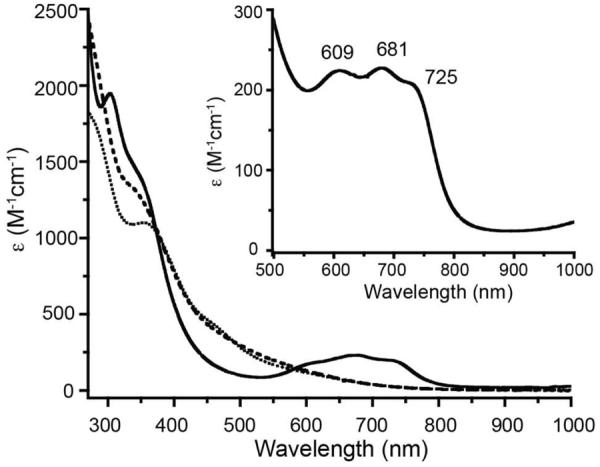
Spectral changes in the UV-vis spectrum of SODA upon stepwise addition under anaerobic conditions of an aqueous solution (50 mM NEM buffer, pH 7.7) of Co(II). The inset shows the binding curves extracted at three different wavelengths from the spectra (squares 681 nm, circles 709 nm, and triangles 725 nm). The ratios of Co(II):SODA for which spectra are shown are 0:1, 0.13:1, 0.26:1, 0.39:1, 0.52:1, 0.65:1, 0.78:1, 0.91:1, 1.04:1, 1.17:1, and 1.3:1.