
Figure 2.
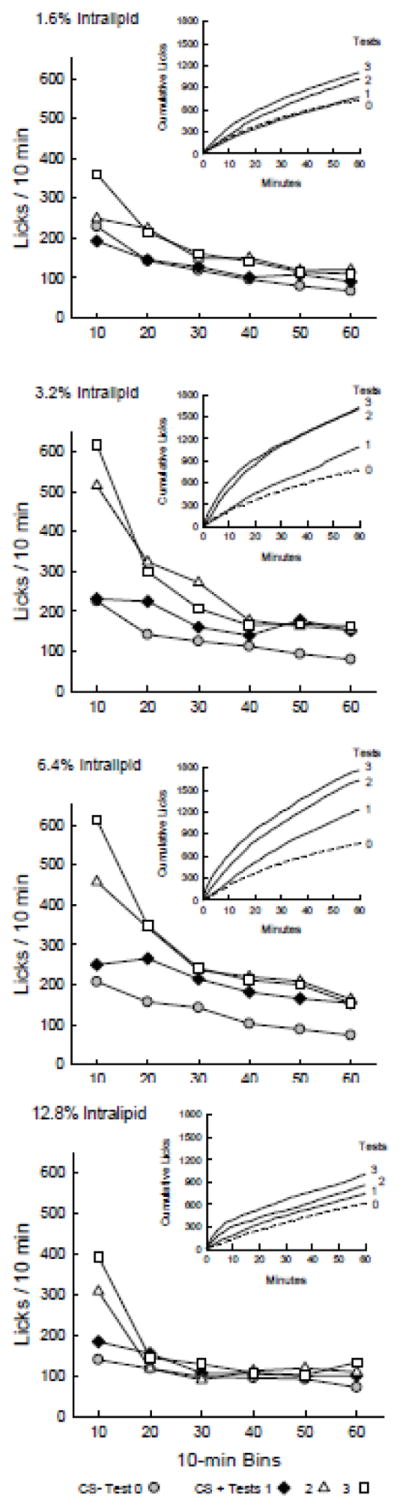
Experiment 1. Licks per 10-min bin are plotted for Test 0 with CS− flavored saccharin solution paired with IG water self-infusions, and for Tests 1 – 3 with CS+ flavored saccharin solution paired with IG Intralipid self-infusions. Graph insets plot cumulative lick curves for Tests 0–3. A. 1.6% IG Intralipid group. Analysis of the 10-min data revealed no differences in licks per bin between CS+ Tests 1–3 and CS− Test 0. B. 3.2% IG Intralipid group. The mice licked more (P < 0.05) for CS+ in bins 1–3 of Test 2 and bins 1–2 of Test 3 than in Test 0. C. 6.4% IG Intralipid group. The mice licked more (P < 0.05) for CS+ in bins 1–6 of Tests 2 and 3 than in Test 0. D. 12.8% Intralipid group. The mice licked more (P < 0.05) for CS+ in bin 1 of Test 2 and bins 1 and 6 of Test 3 than in Test 0.