
Figure 5.
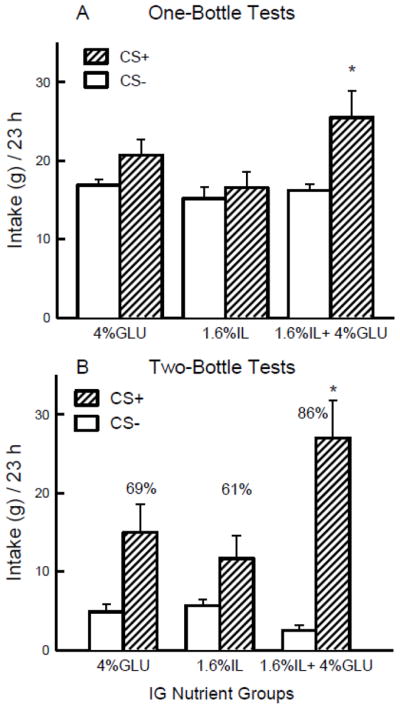
Experiment 2B. A. Mean (+sem) 23-h total intakes (oral + infused) are plotted for one-bottle CS− and CS+ training. The mice drank (23 h/day) a CS− flavored saccharin solution paired with IG water self-infusions on odd-numbered days and a CS+ flavored saccharin solution paired with IG nutrient self-infusions on even-numbered days, for a total of 5 CS− and 5 CS+ days in two training cycles. The three IG groups were infused with 4% glucose, 1.6% Intralipid, and 1.6% Intralipid + 4% glucose. B. Mean (+sem) 23-h total intakes are plotted for CS+ and CS− flavored saccharin solutions during the second two-bottle preference test for the 4% glucose, 1.6% Intralipid, and 1.6% Intralipid + 4% glucose IG groups. CS+ and CS− intakes remained paired with IG self-infusions during the test. Number atop bar represents mean percent preference for the CS+ solution. Significant differences (P < 0.05) between CS+ and CS− licks are indicated by an asterisk.