
Figure 2.
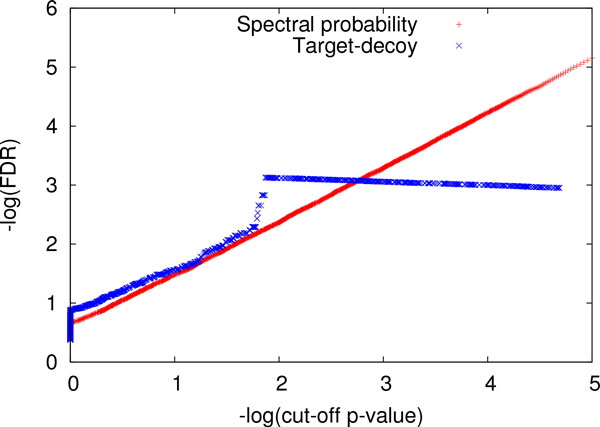
A comparison of the FDRs of PrSMs with one PTM estimated by the target-decoy approach and computed based on spectral probabilities. For a given cut-off p-value, the two reported FDRs are compared, and − log(FDR) (base 10) is plotted against − log(cut-off p-value) (base 10).