
Figure 1.
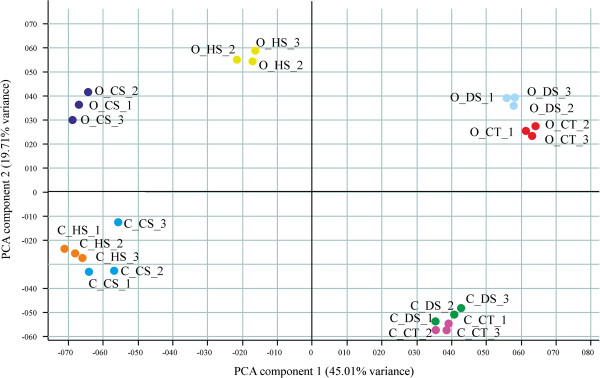
Principal Component Analysis (PCA plot) of the wheat array hybridization data. The x and y axis represent the two principal components of the total variance, 45.01% and 19.71%, respectively. Each dot represents a single repetition of Ofanto and Cappelli RNA samples subjected to different stress conditions. C_CT and O_CT = Cappelli control and Ofanto control samples; C_DS and O_DS = Drought stressed samples; C_HS and O_HS = Heat stressed samples; C_CS and O_CS = Combined stress samples.