
Figure 4.
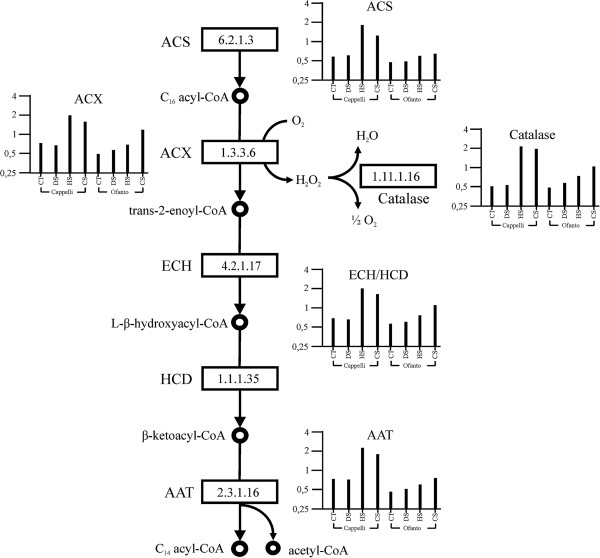
Representation of the β-oxidation pathway: variations in the expression levels of the genes coding for the key enzymes. The four treatment conditions, grouped by genotypes, are plotted on x axis. The relative expression level (data normalized to the median for each probe set) is plotted on the y axis. ACS: acyl-CoA synthase (EC 6.2.1.3); ACX: acyl-CoA oxidase (EC 1.3.3.6); Catalase: peroxisome catalase (EC 1.11.1.6); ECH: enoyl-CoA hydratase (EC 4.2.1.17); HCD: L-β-hydroxyacyl-CoA dehydrogenase (EC 1.1.1.35); AAT: acyl-CoA-acetyltransferase enzyme or thiolase (EC 2.3.1.16). CT = Control samples; DS = Drought stressed samples; HS = Heat stressed samples; CS = Combined stress samples.